
Profile
Profile reads the metadata — governor limits, race conditions, Apex exceptions, storage, access — and turns it into findings you can click through to the class or flow behind them. Evidence, not a slide.
100+ enterprise teams trust Laminar with the systems that run their business.


Technical debt
An average enterprise org carries around 24,000 metadata components and a couple thousand security issues, and the person who understood it left two vendors ago. Every change is made against a system nobody can fully read.
How Profile works
Profile reads the org and produces a point-in-time, immutable picture of it. Every finding links to the object, class, or flow it came from, and the findings roll up into a prioritized 30/60/90 roadmap.
Forensics
The failure modes that arrive as tickets, attributed to their cause.
Forensics
The failure modes that arrive as tickets, attributed to their cause.

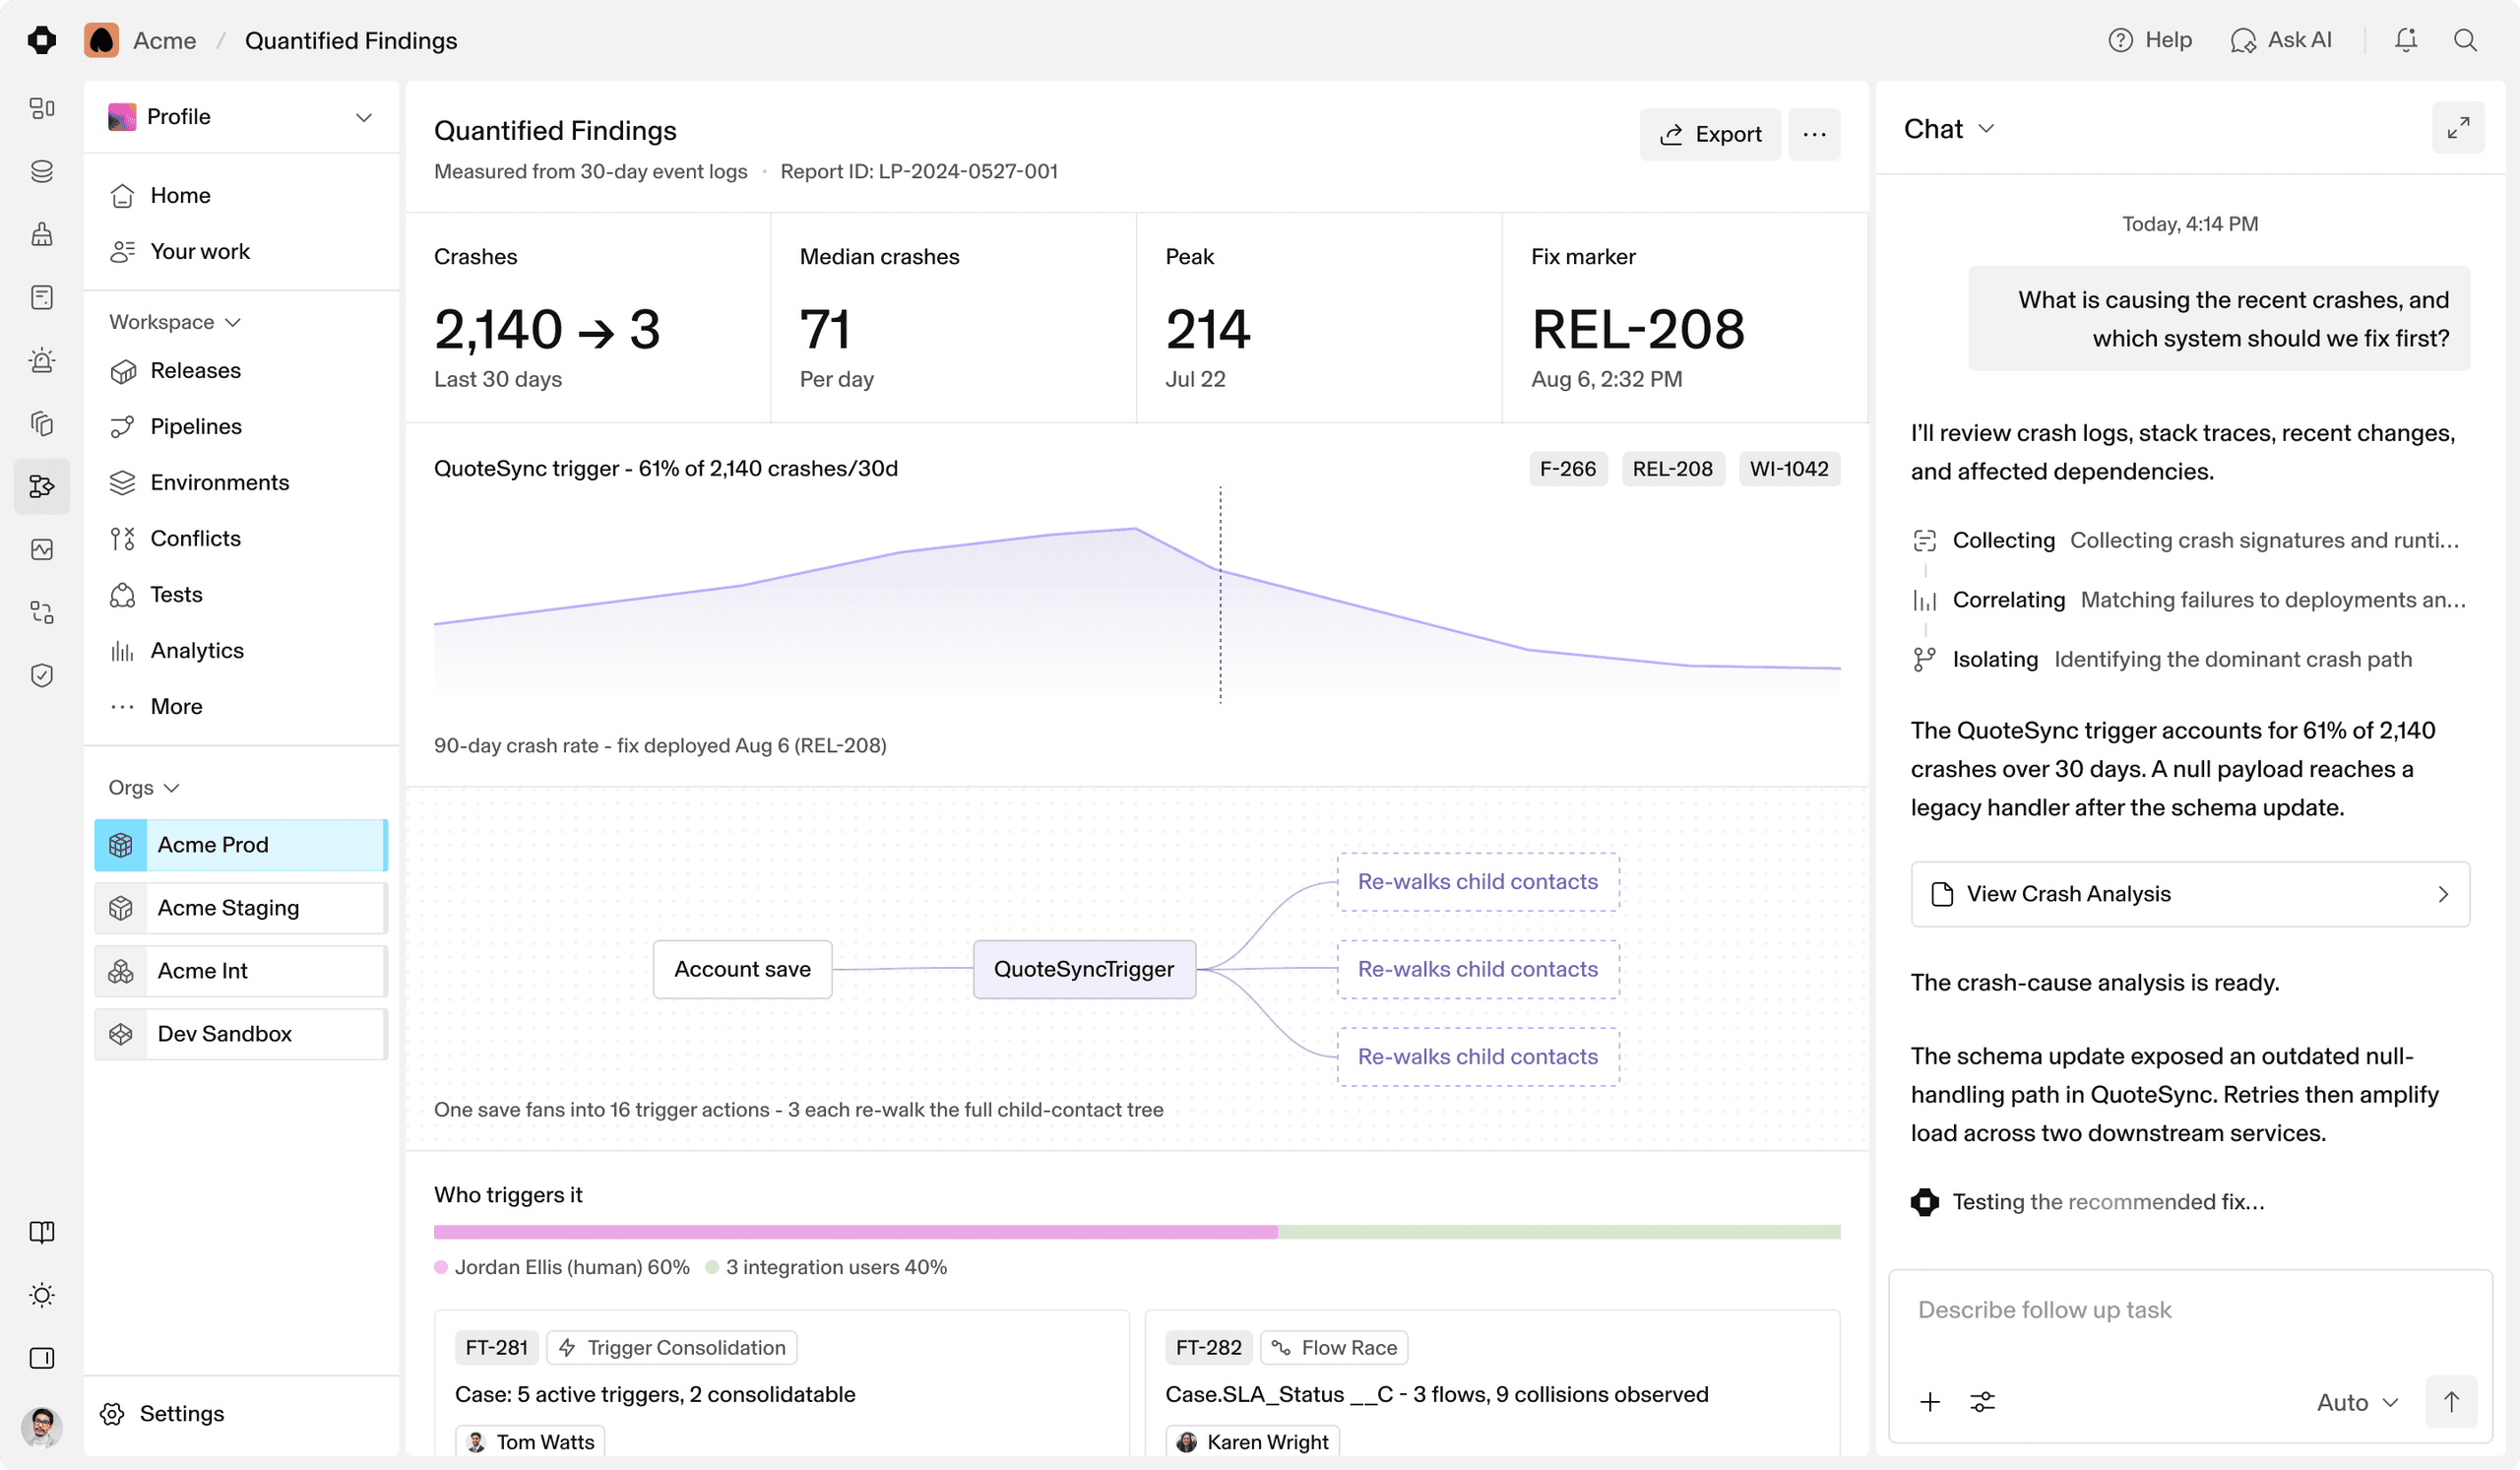
Which trigger, which flow, and how much of the total.
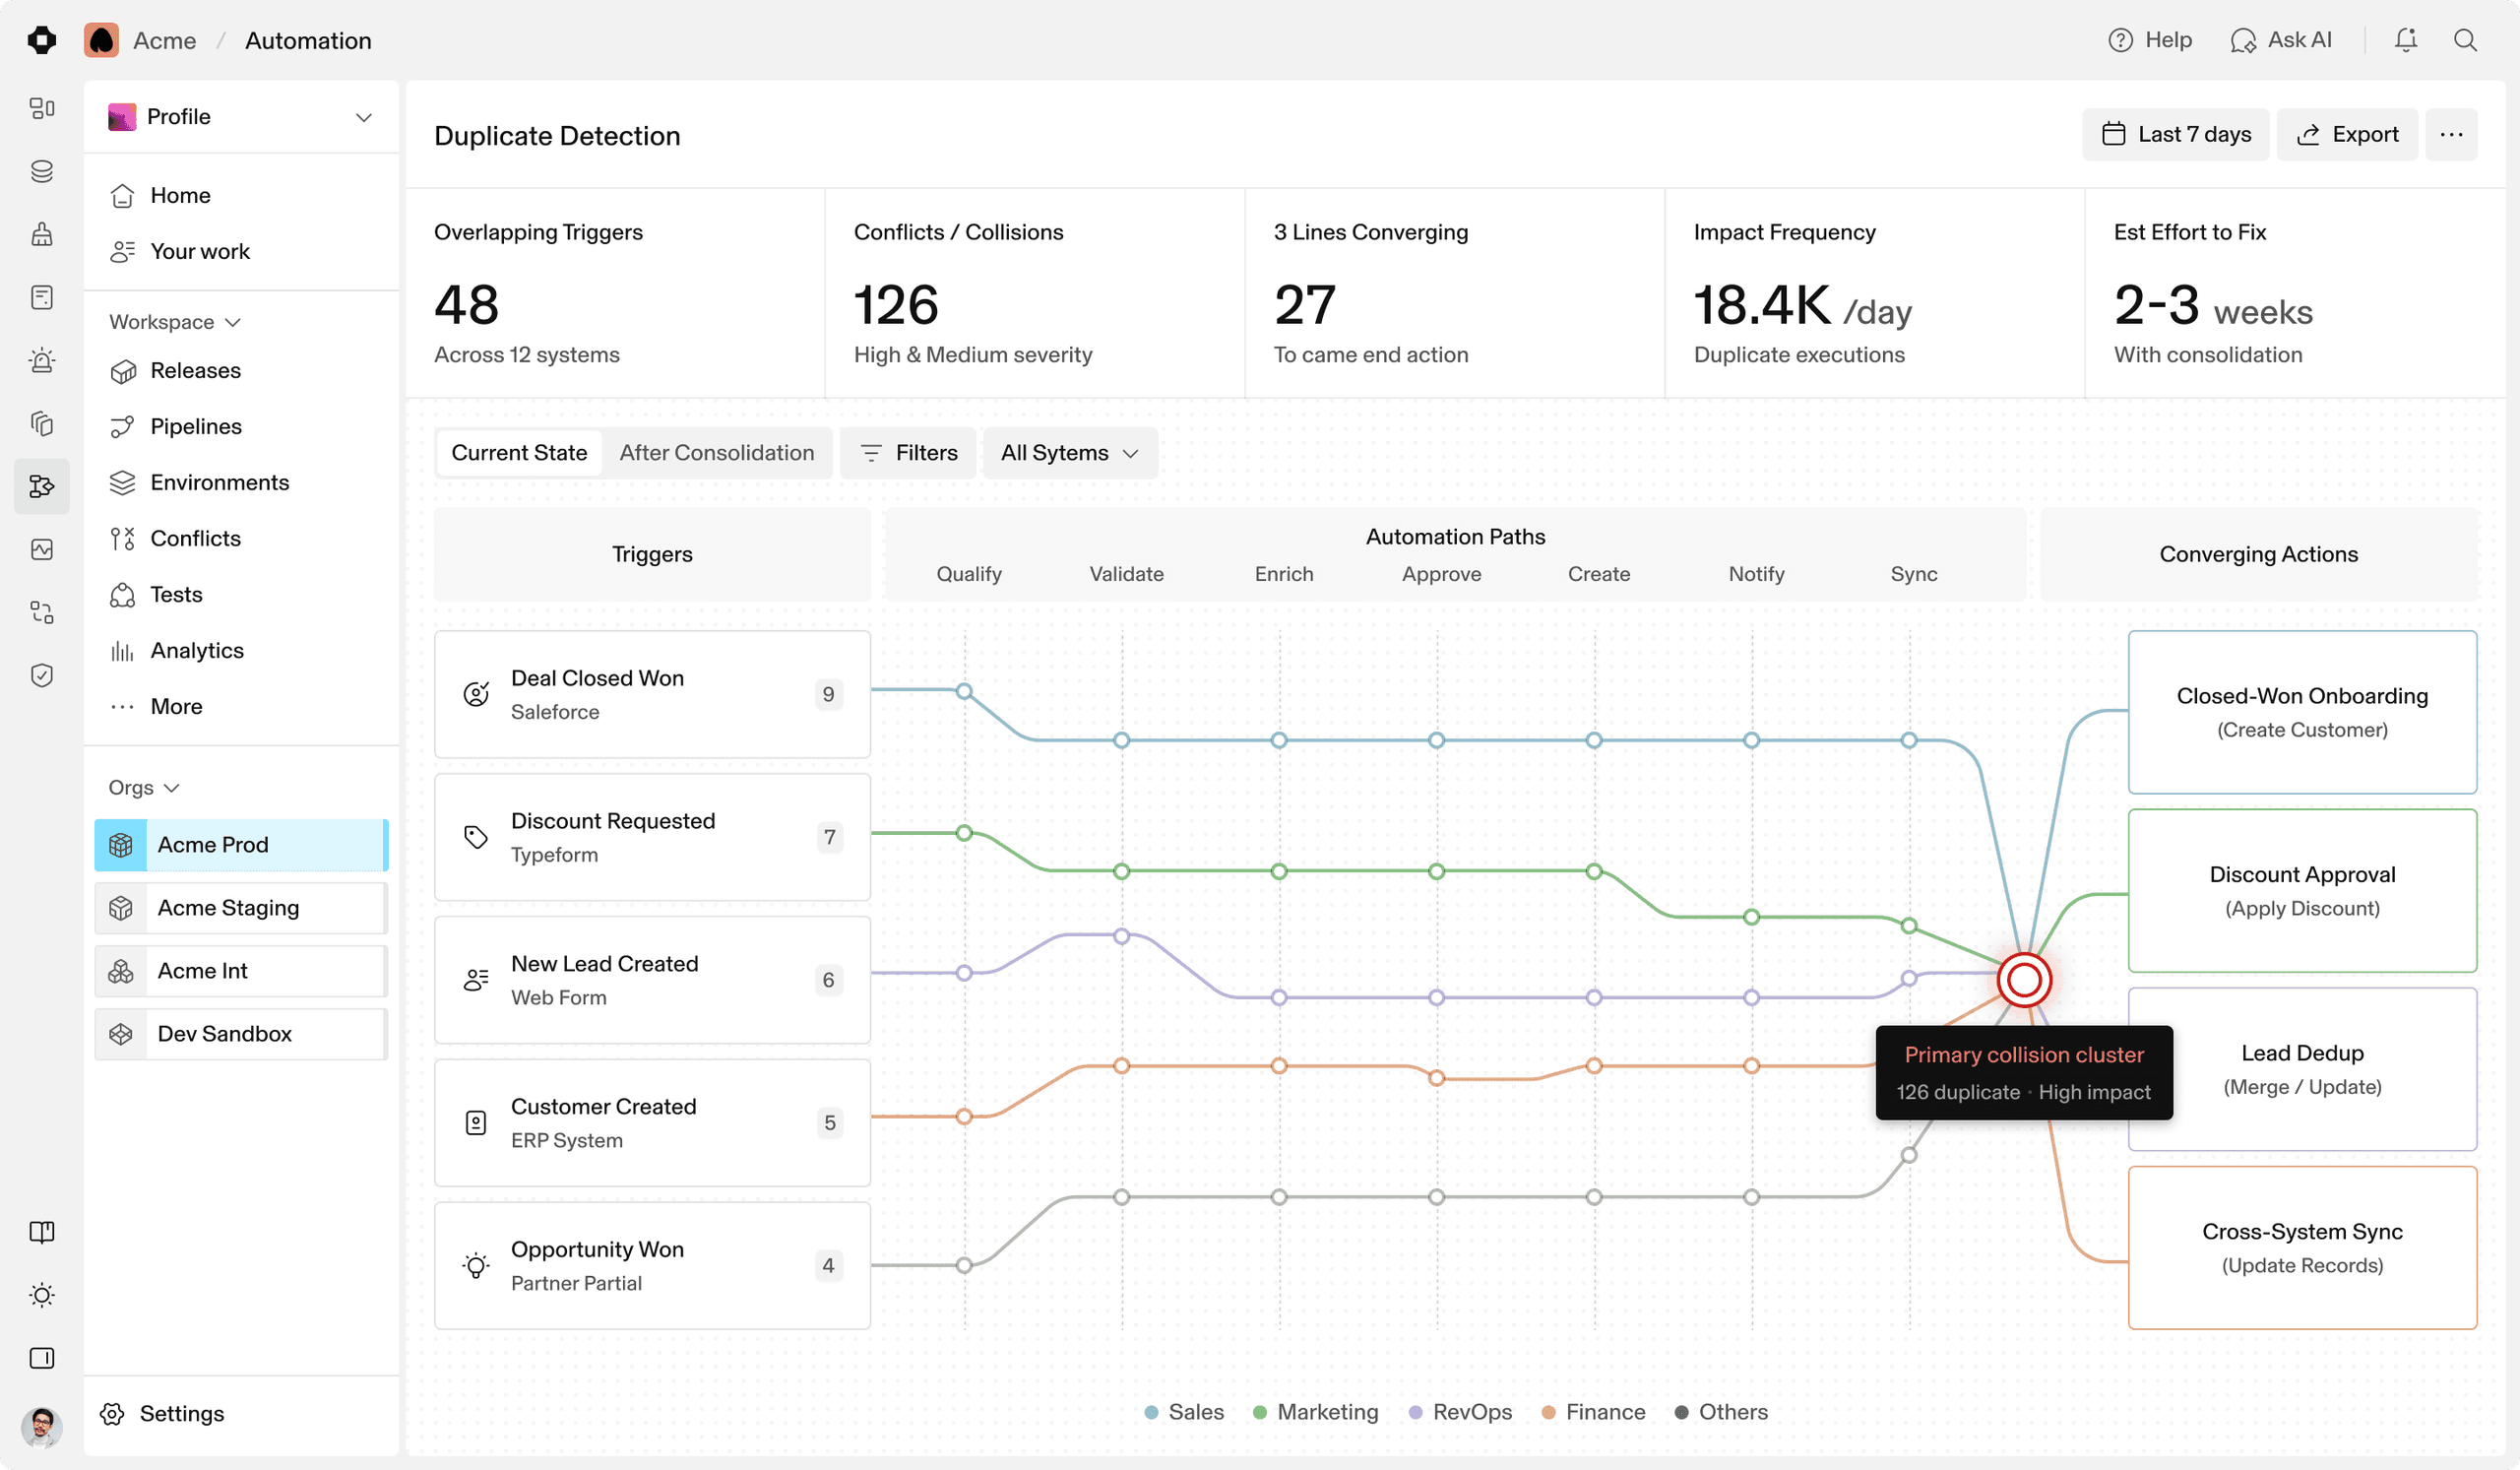
Observed and configured races, named, counted, no longer intermittent.
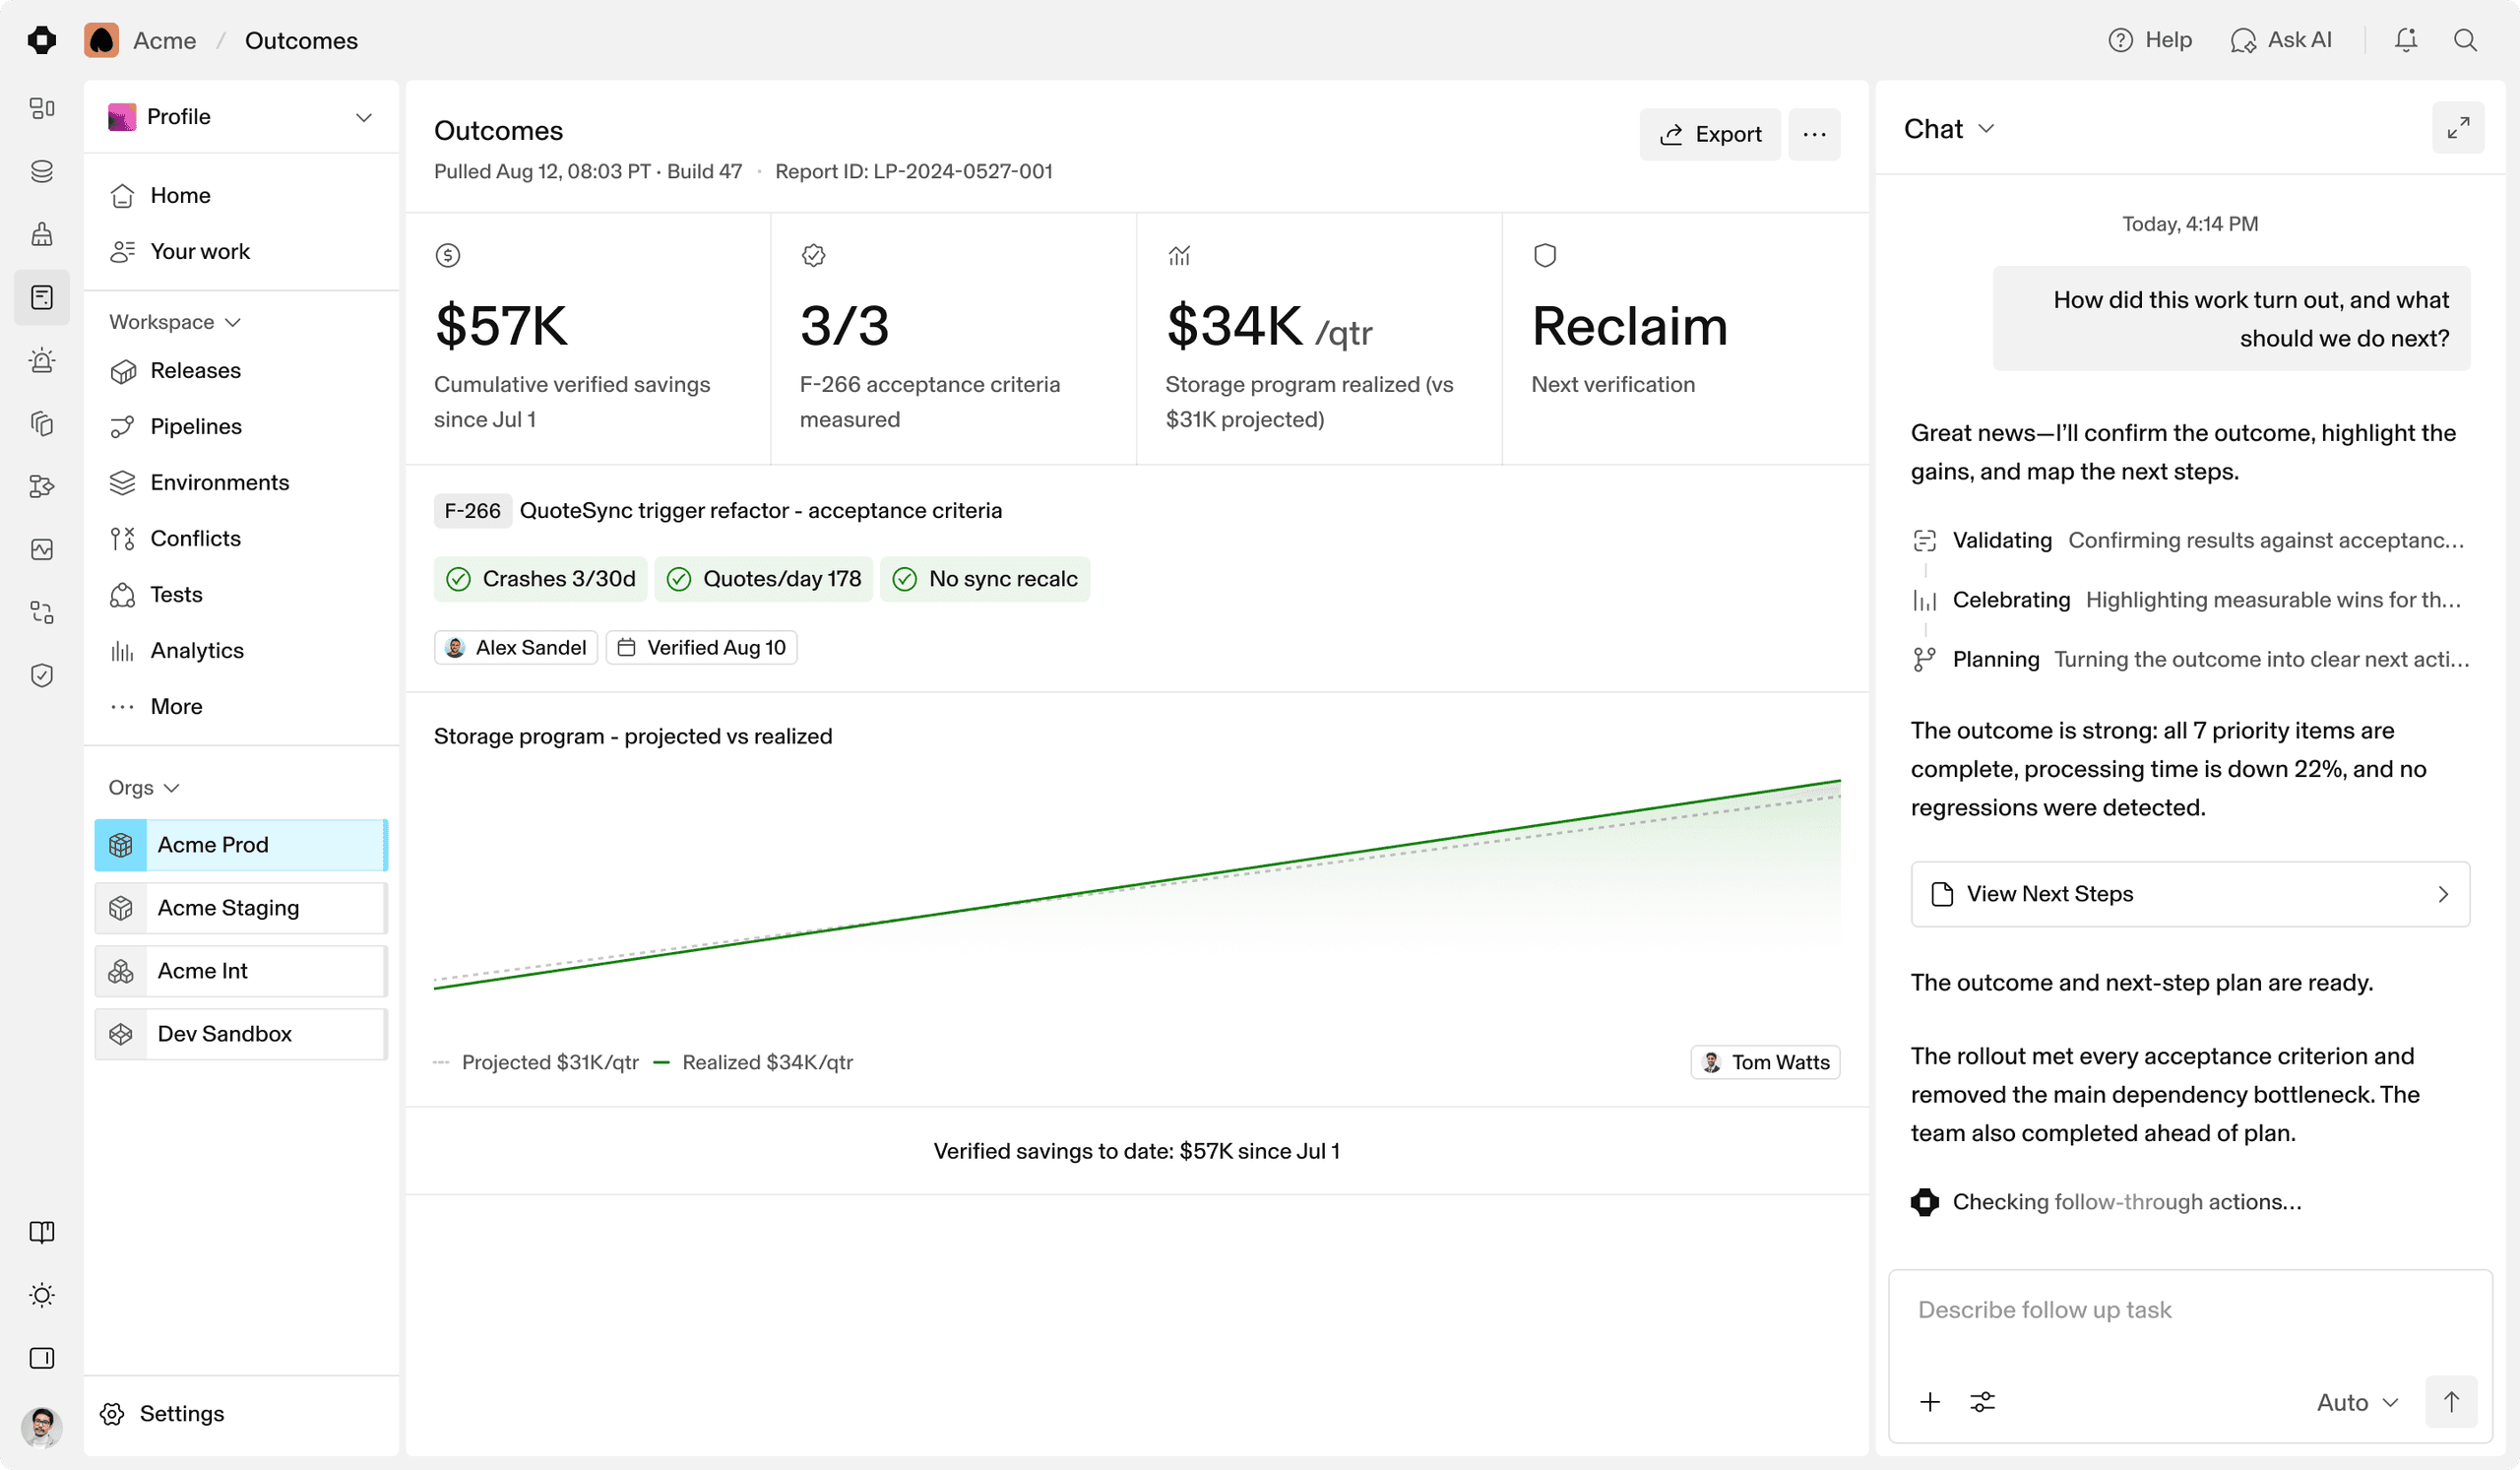
Acceptance criteria measured after the fix lands, projected against realized.
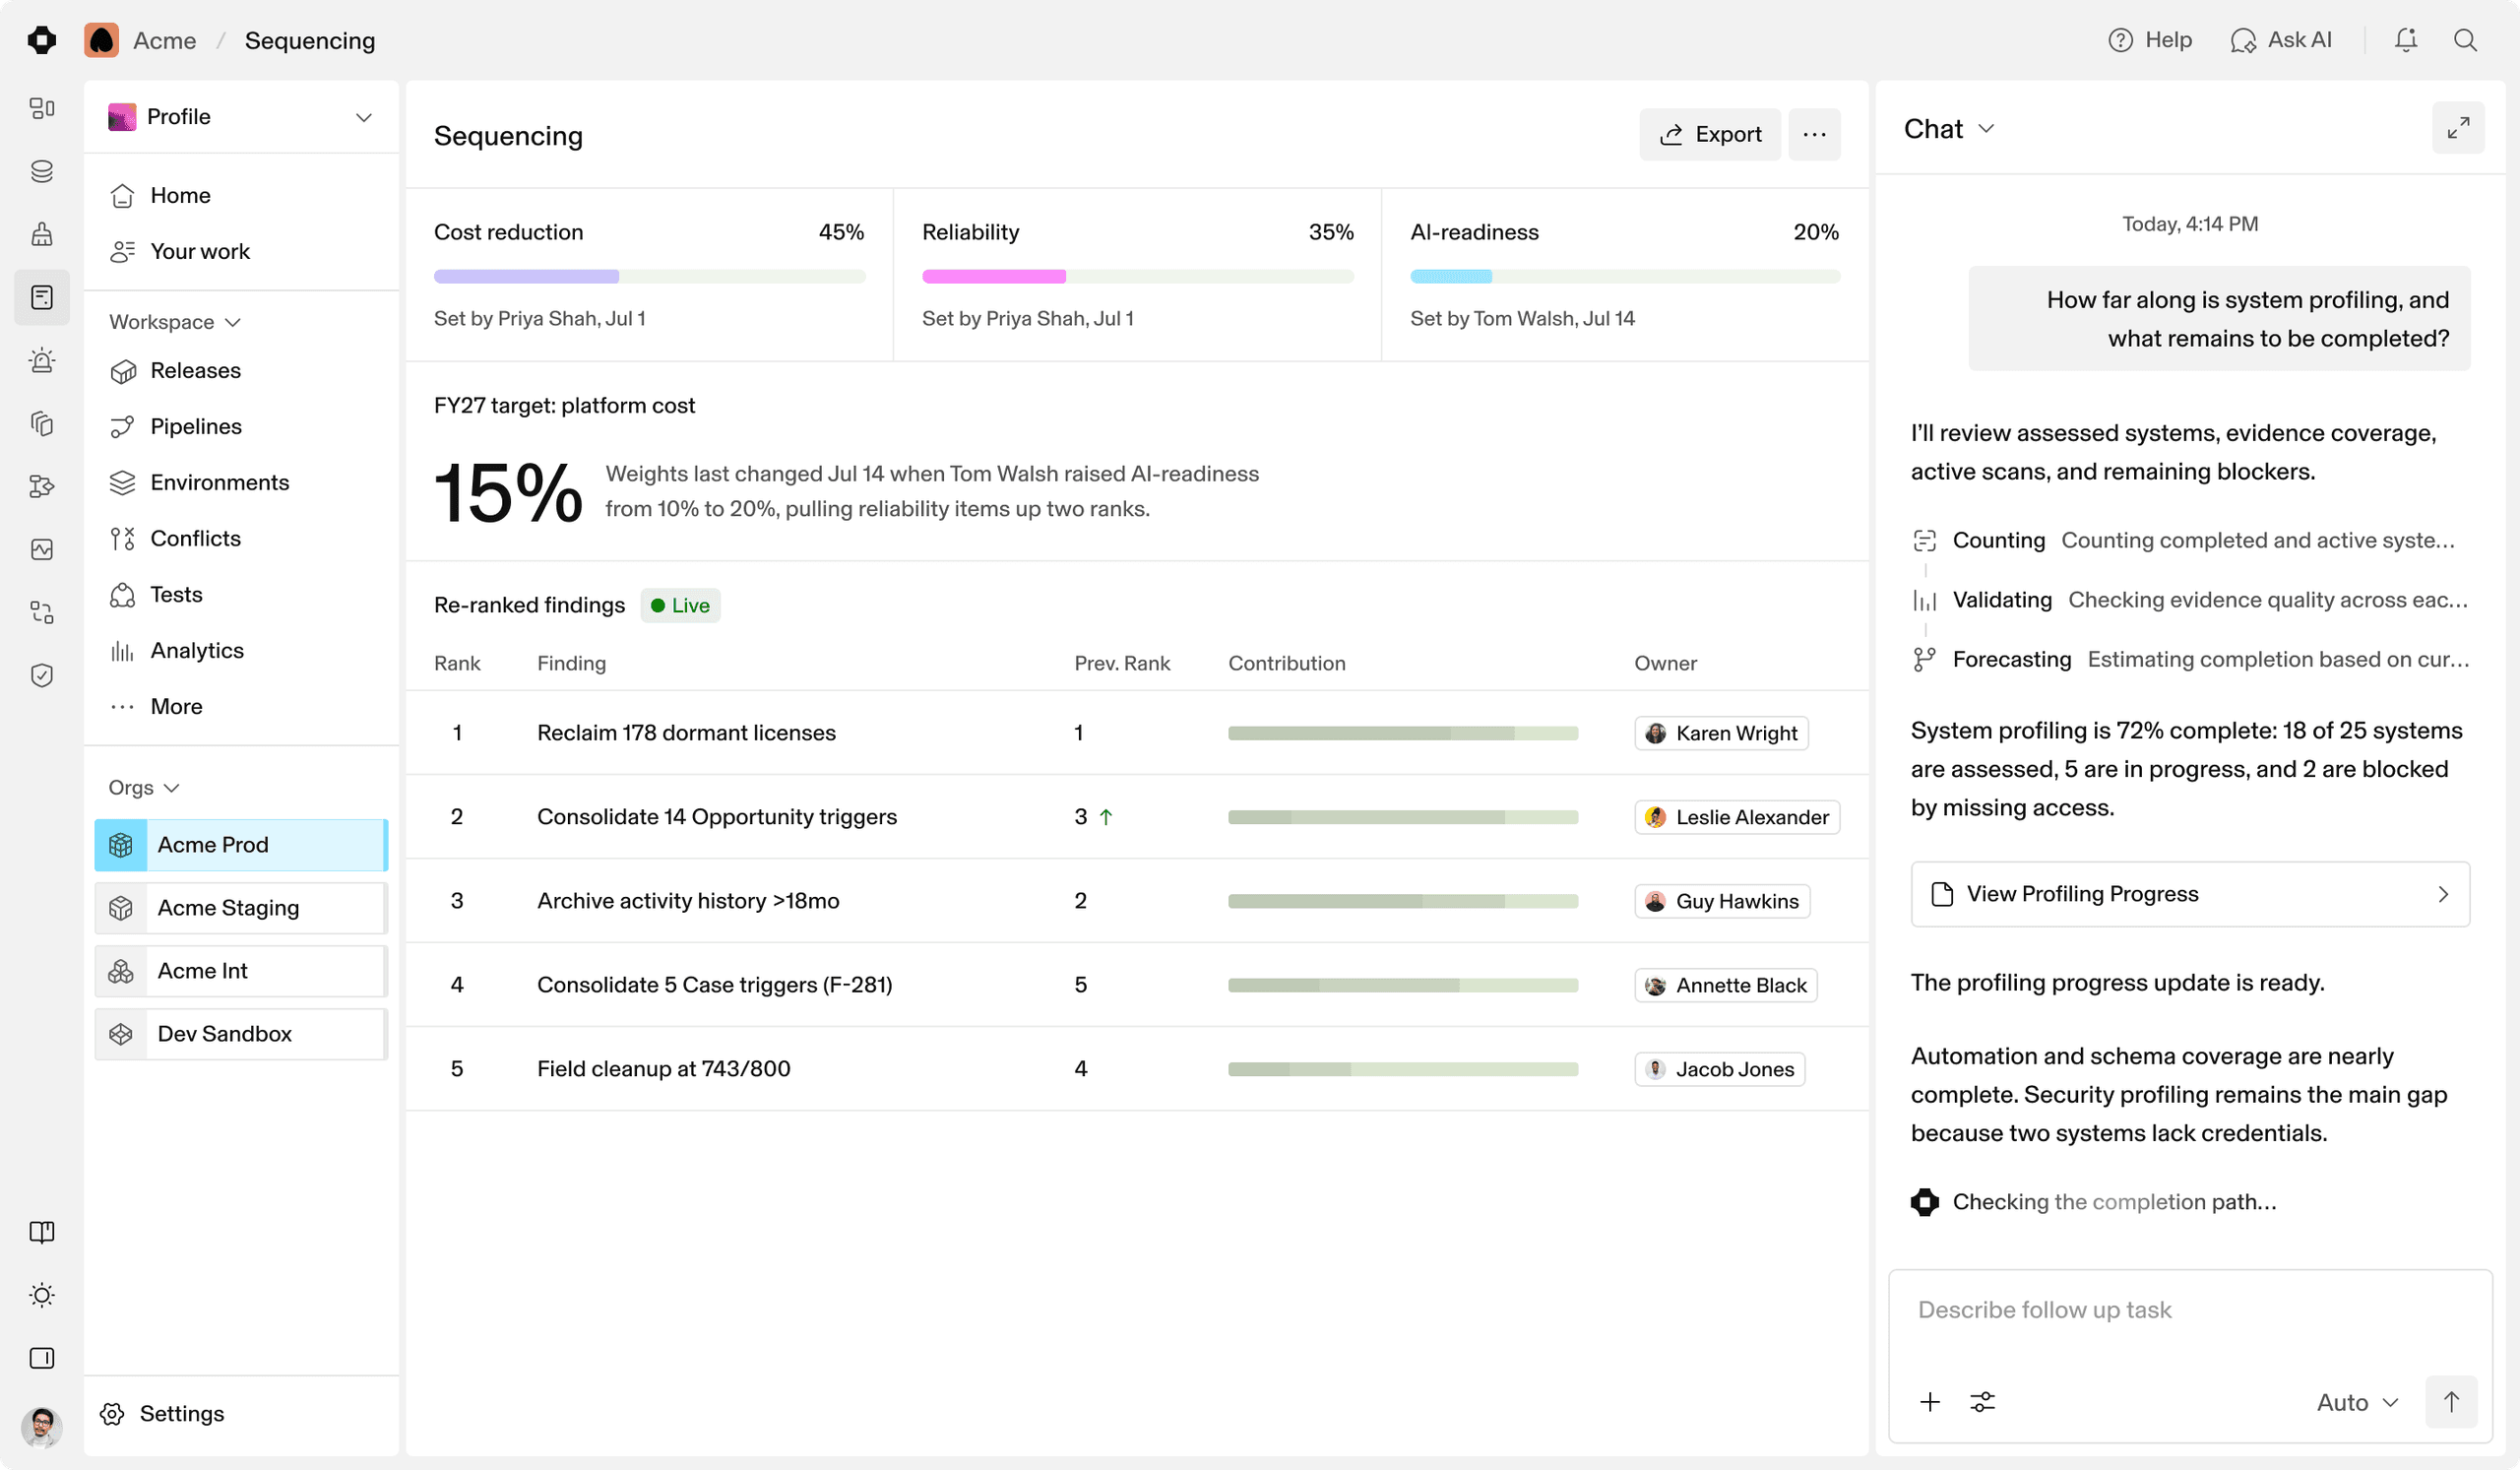
Set cost, reliability and AI-readiness; findings re-rank against it.
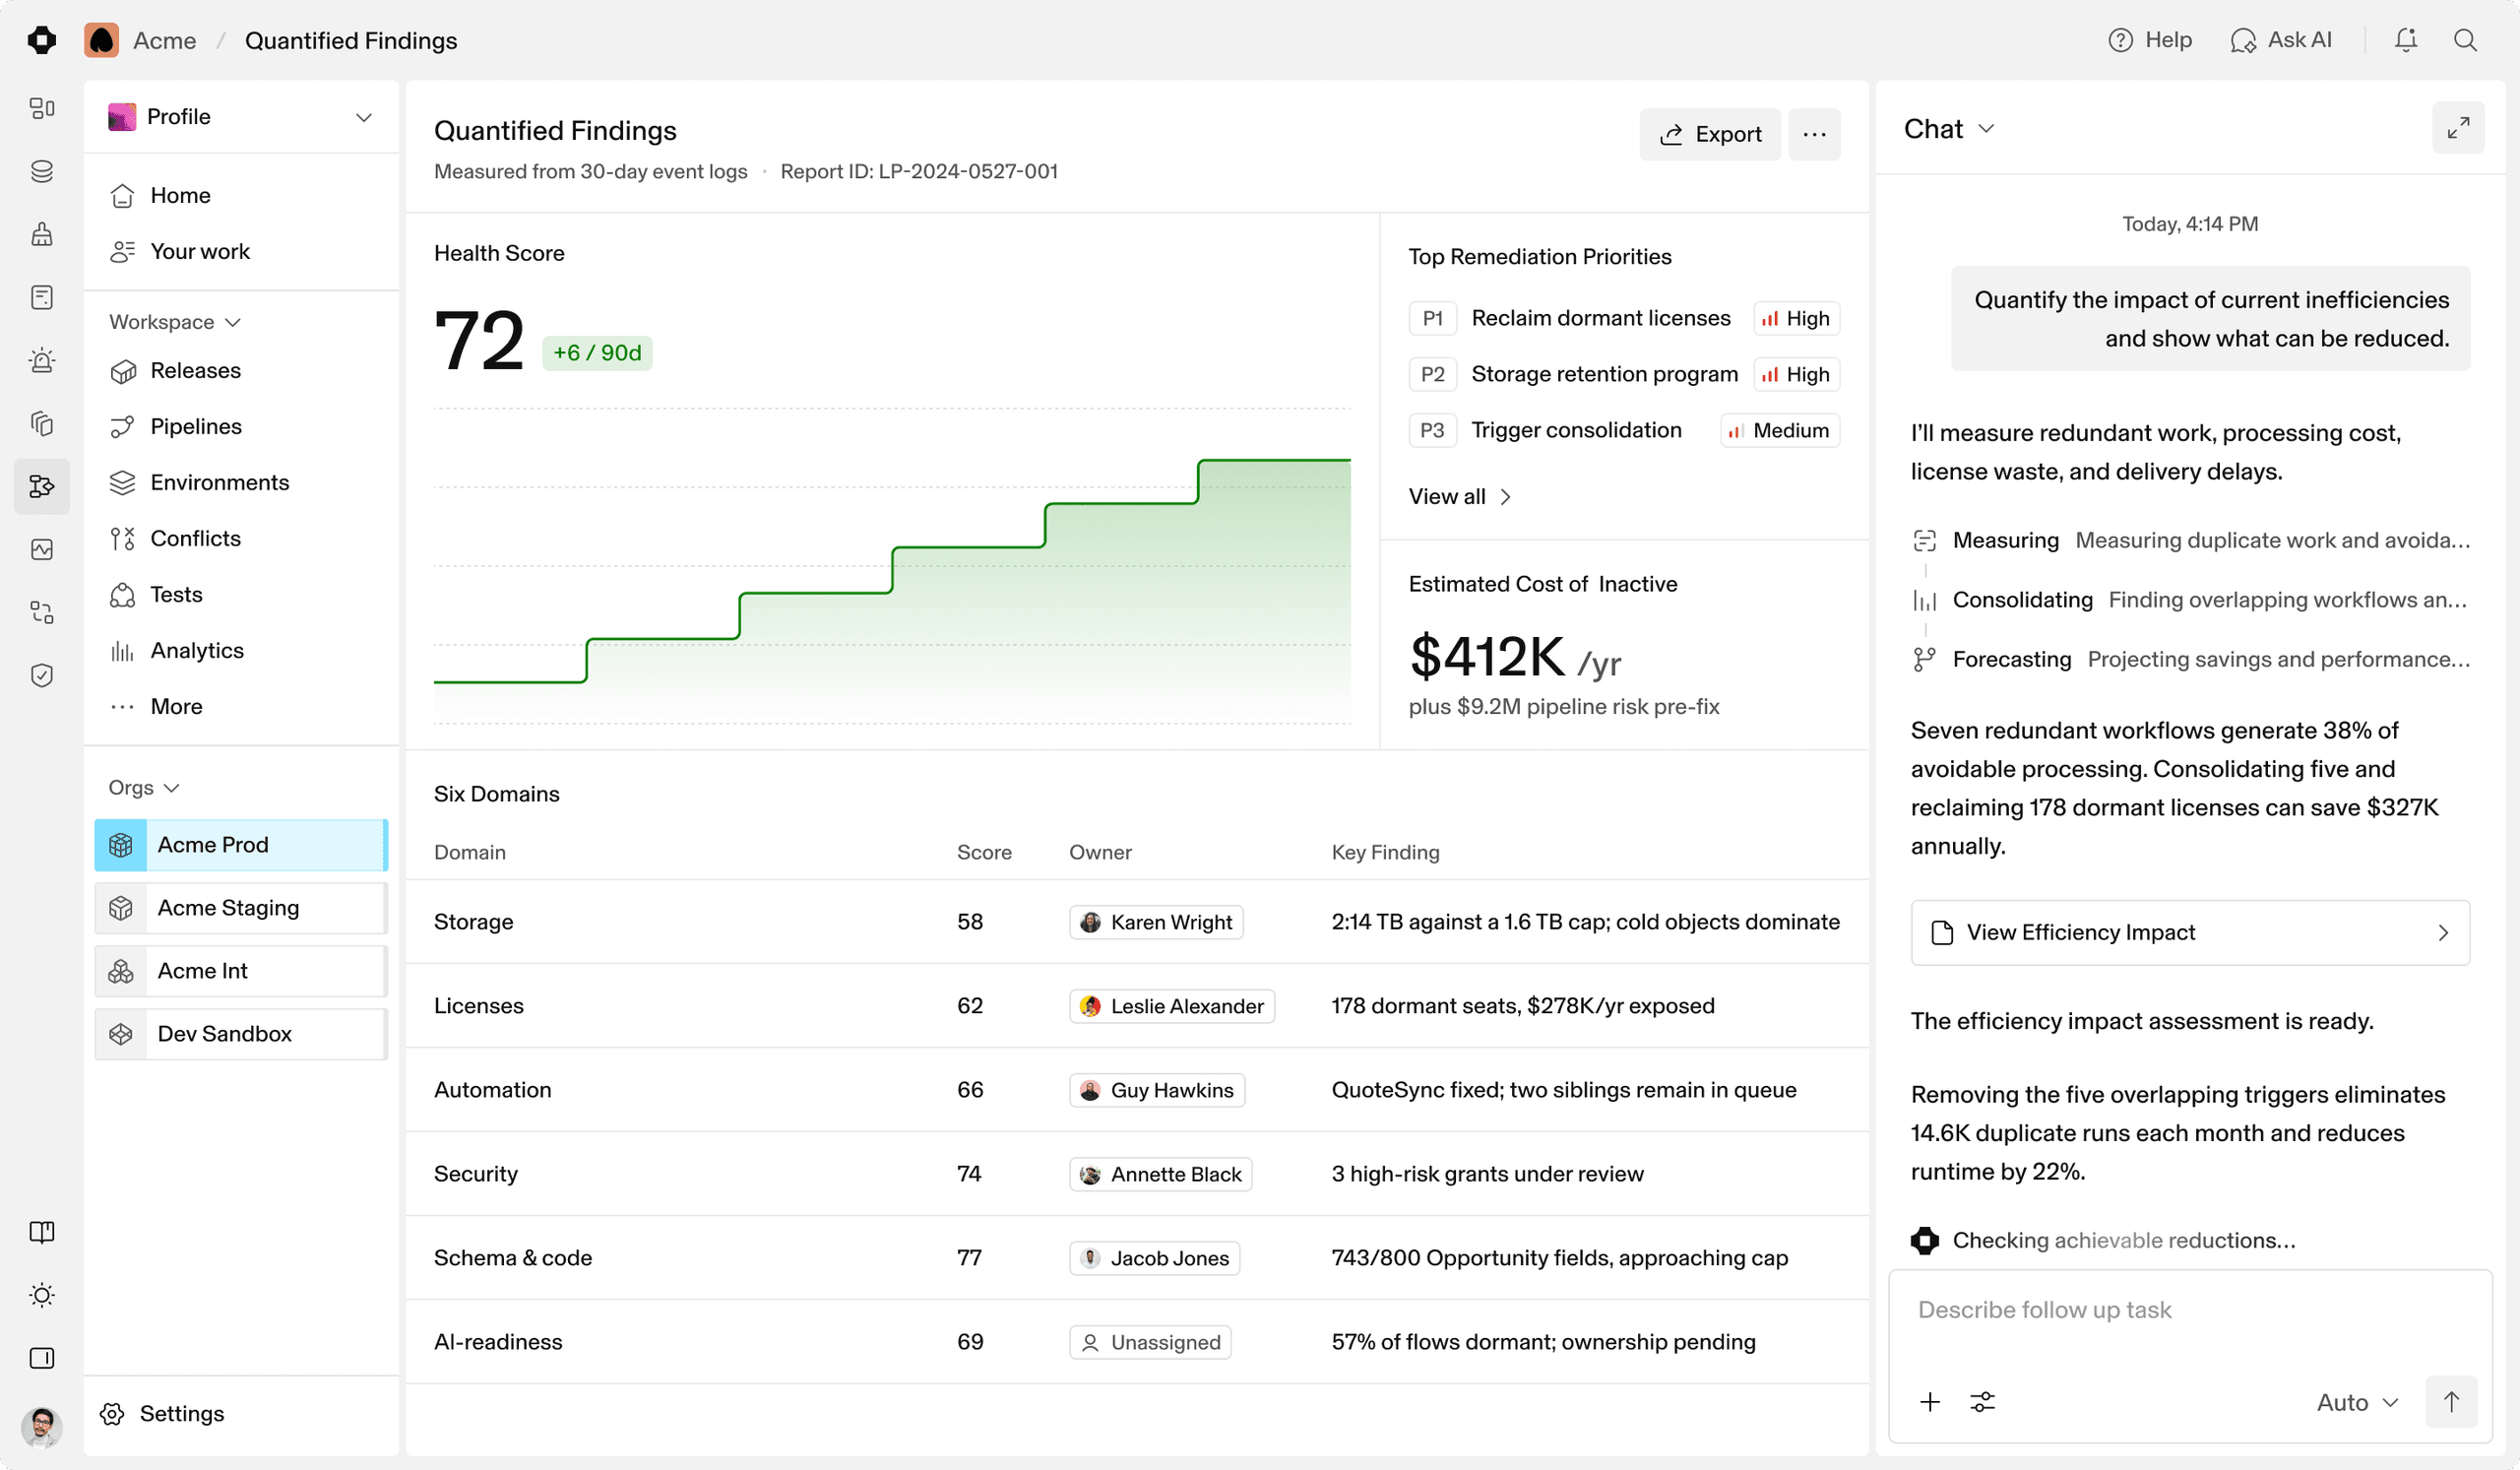
Objects approaching their field limits, before the next project hits.
Storage and spend
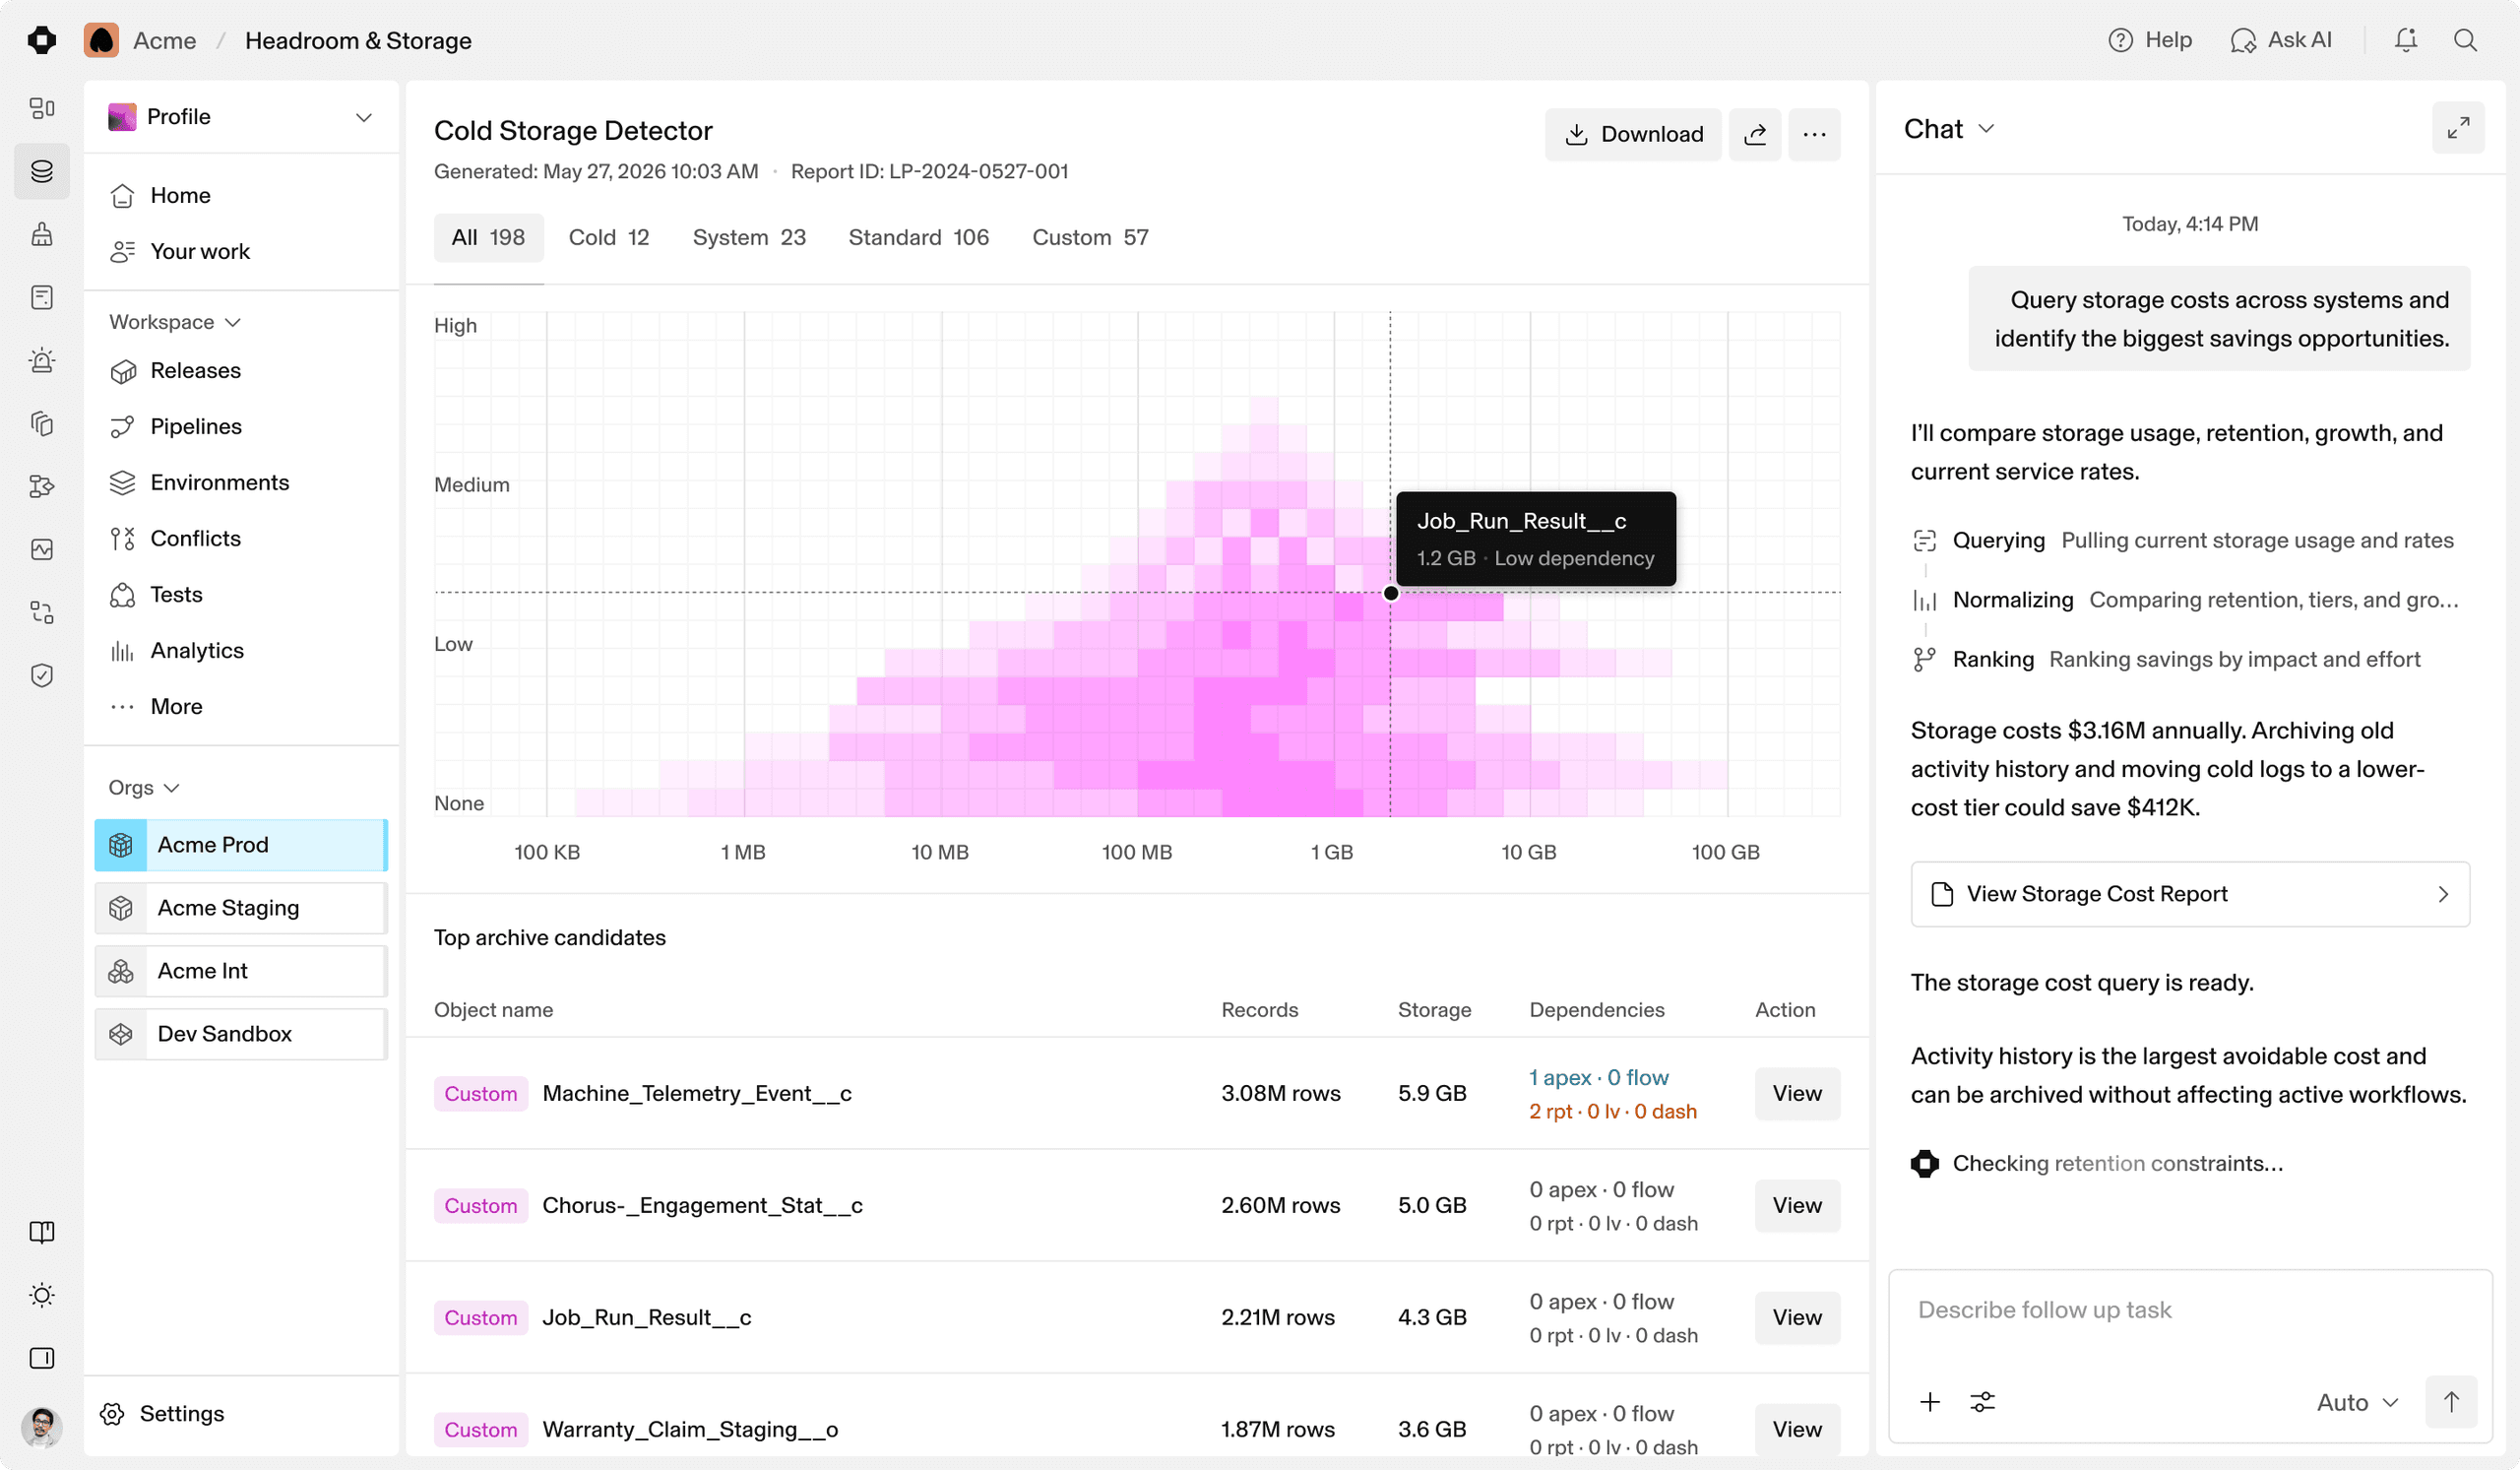
Profile attributes storage and licenses to the objects and people actually using them.
Storage and spend
Profile attributes storage and licenses to the objects and people actually using them.
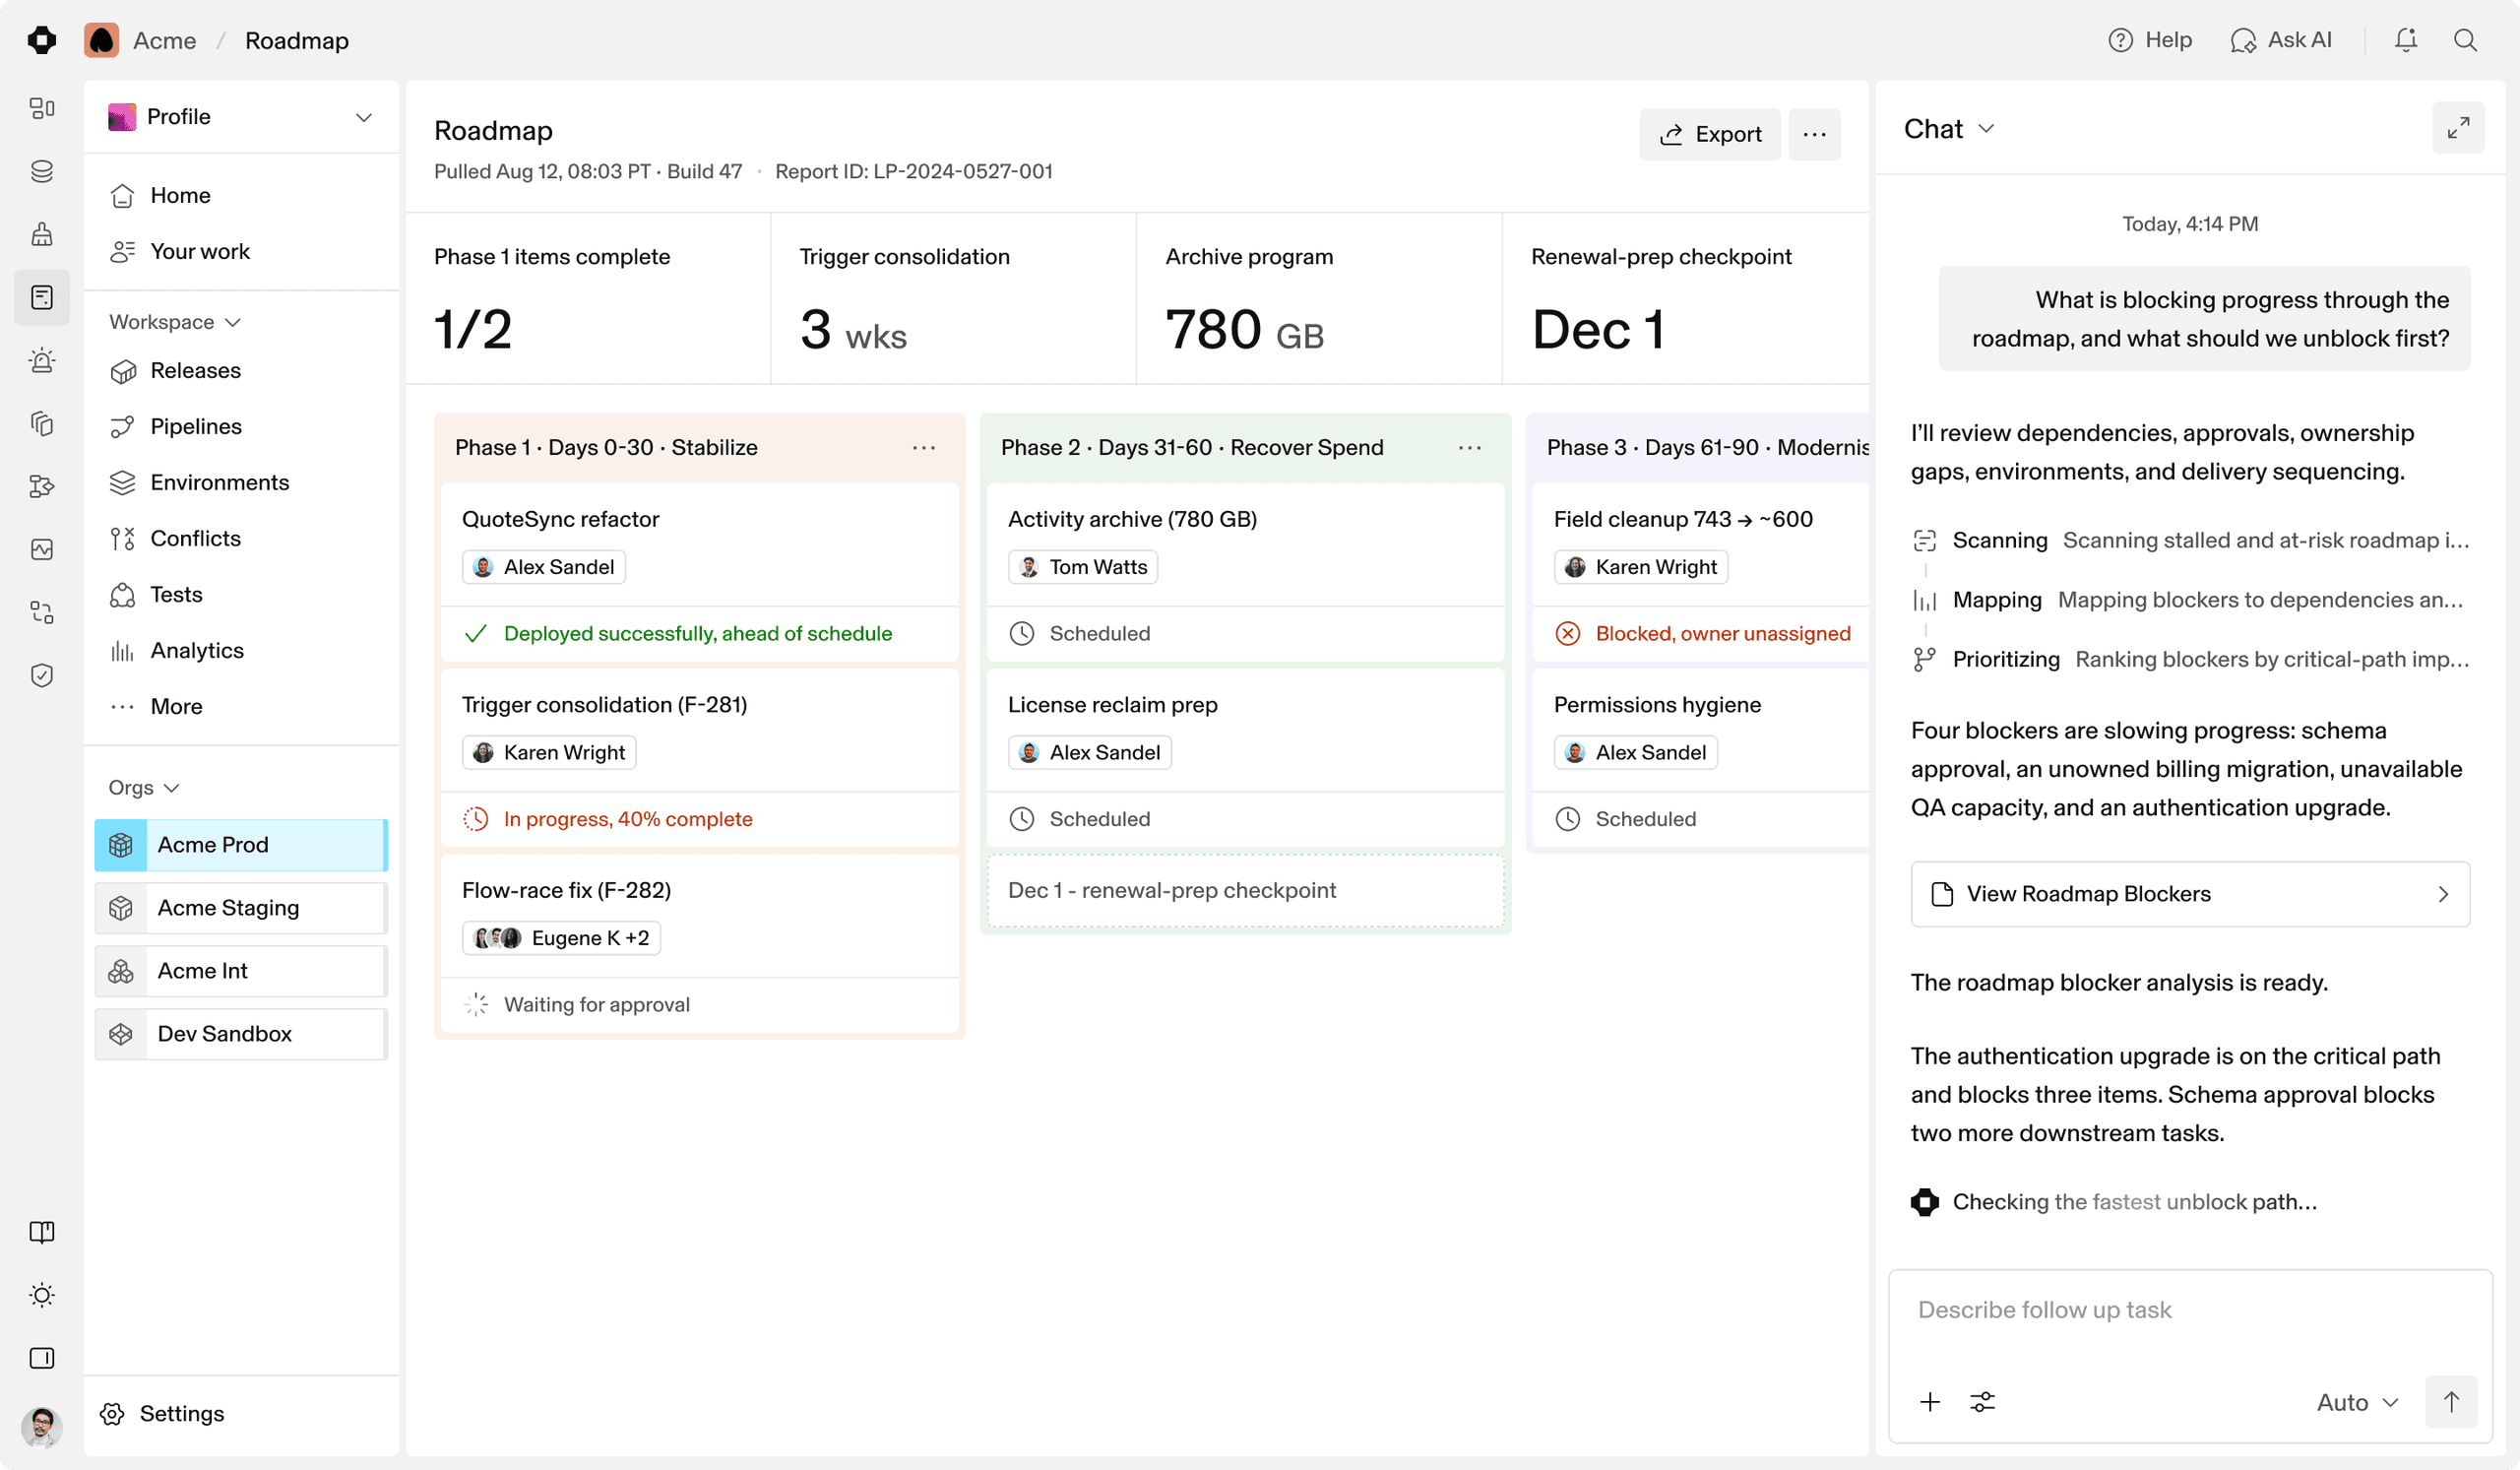
Storage and licence work in phases, each with an owner.
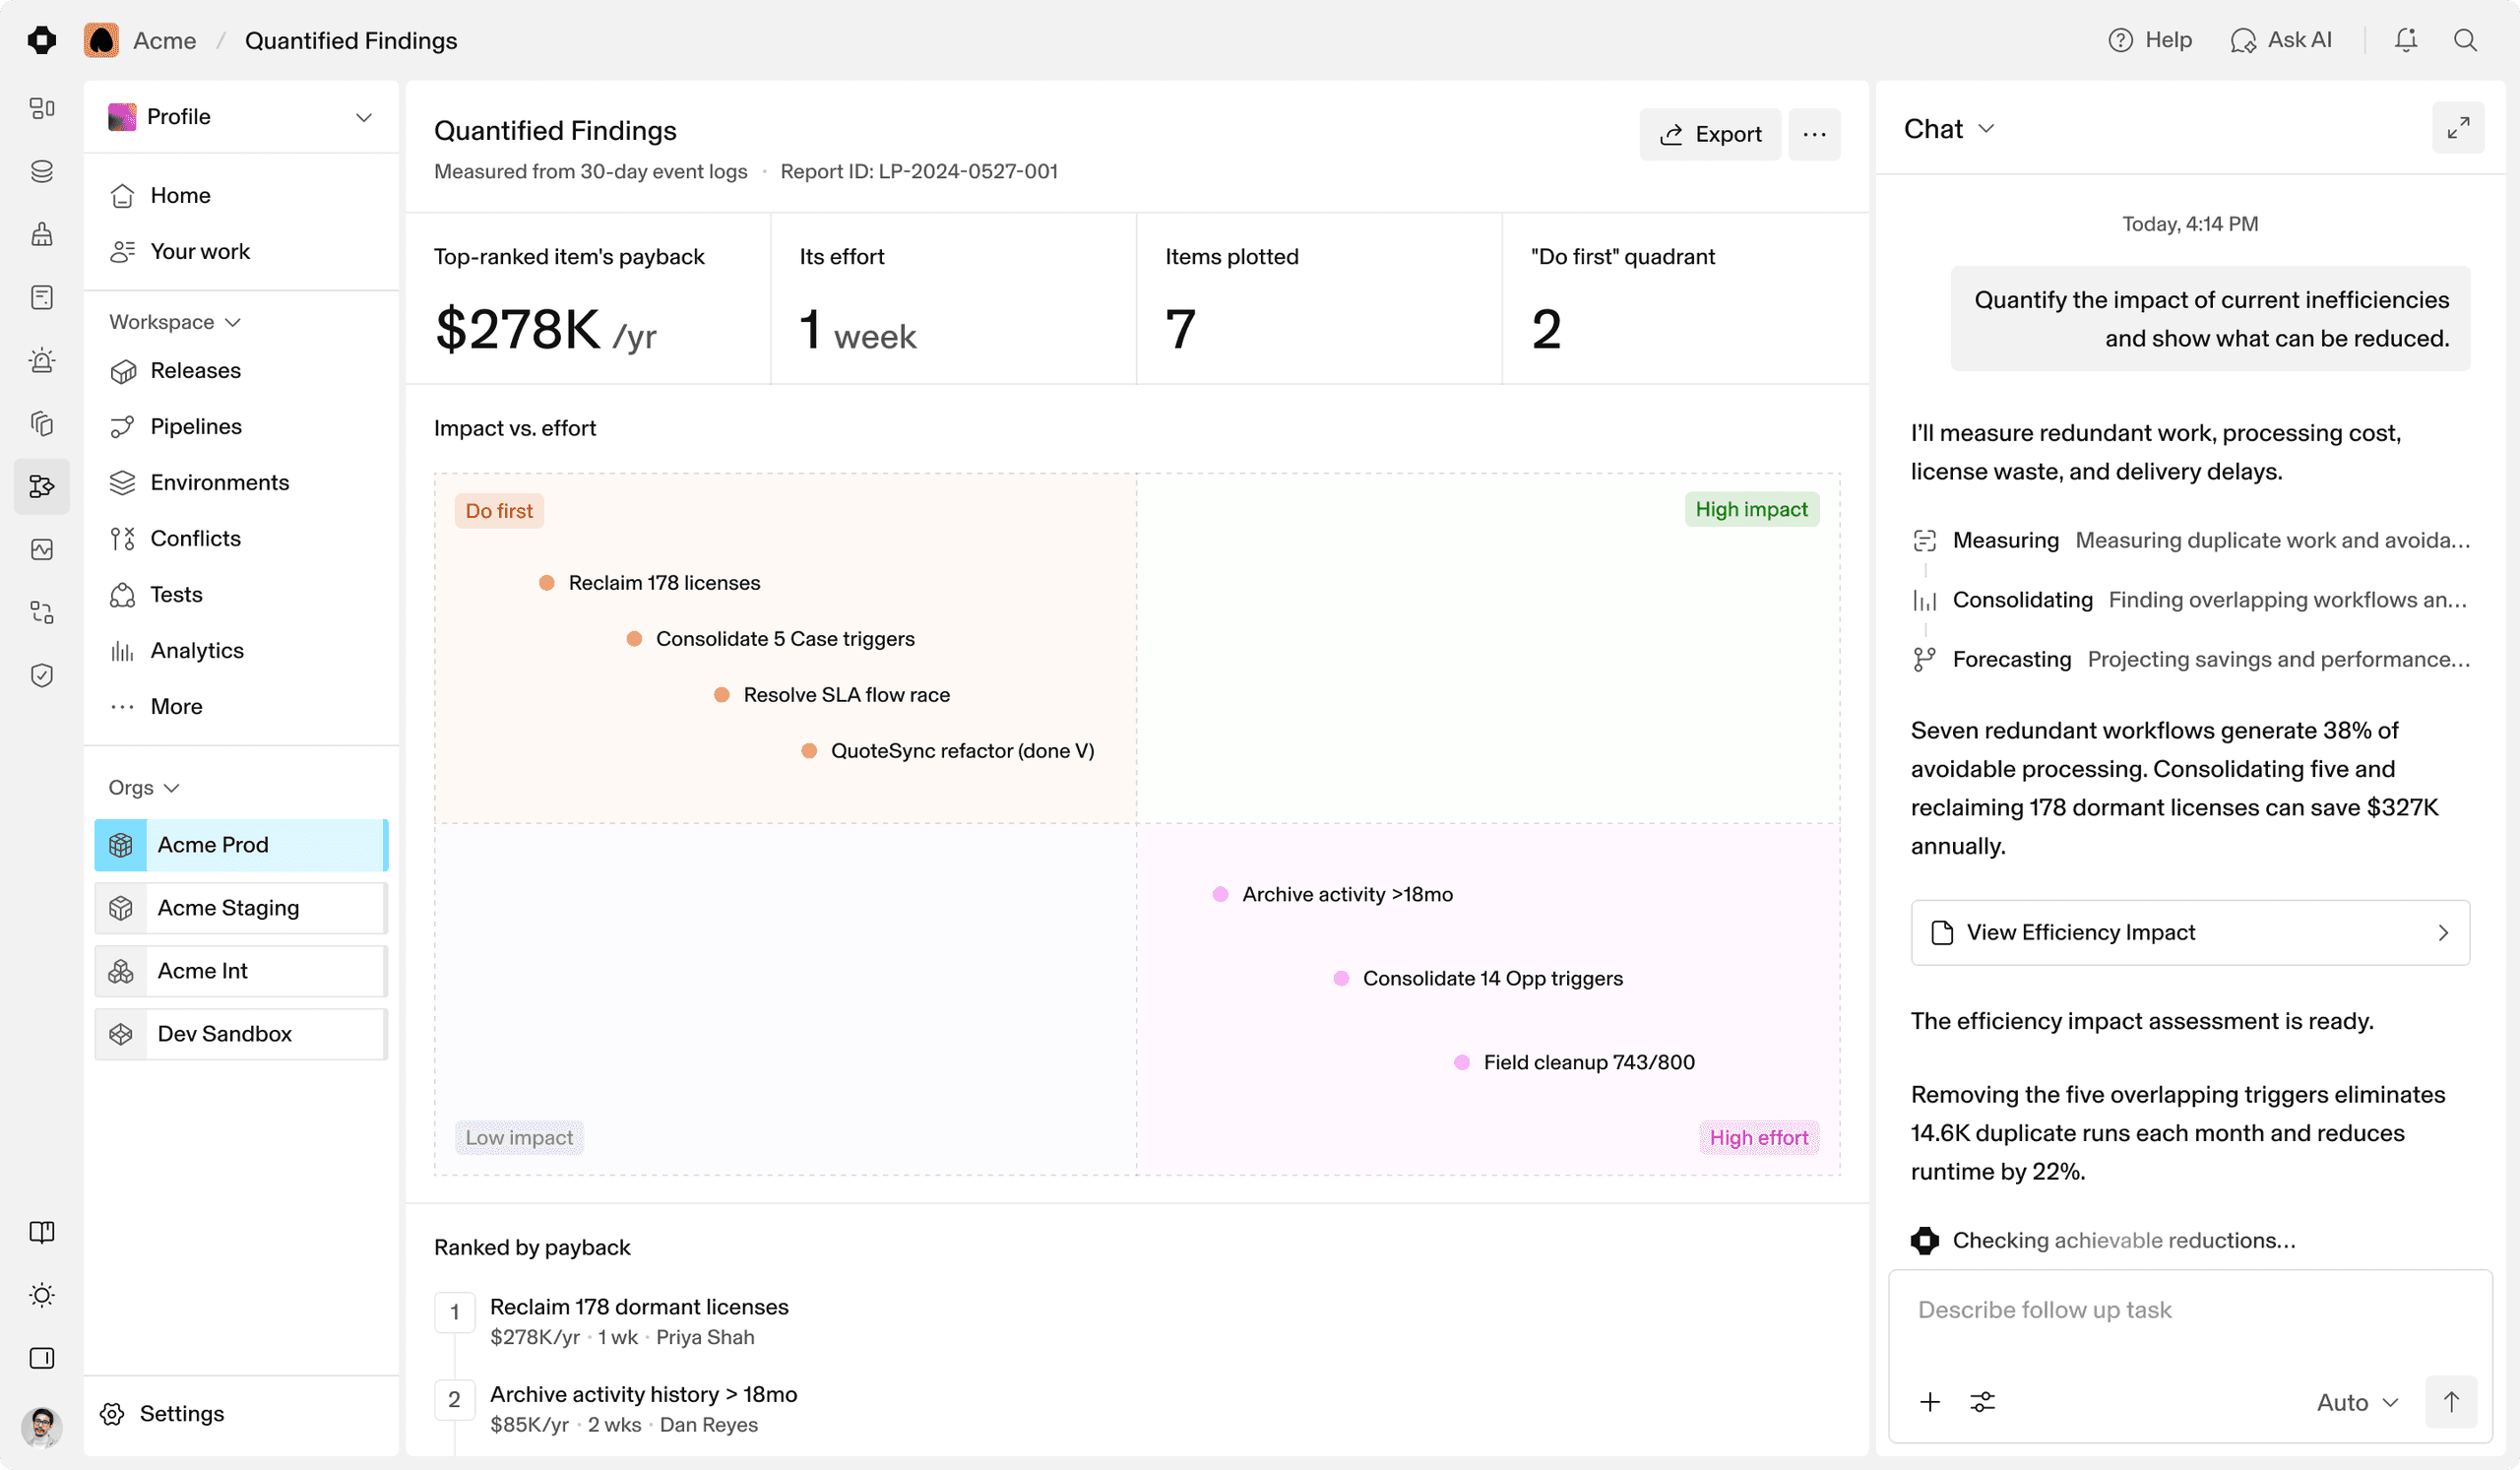
Records no process has read in months, ranked by payback.
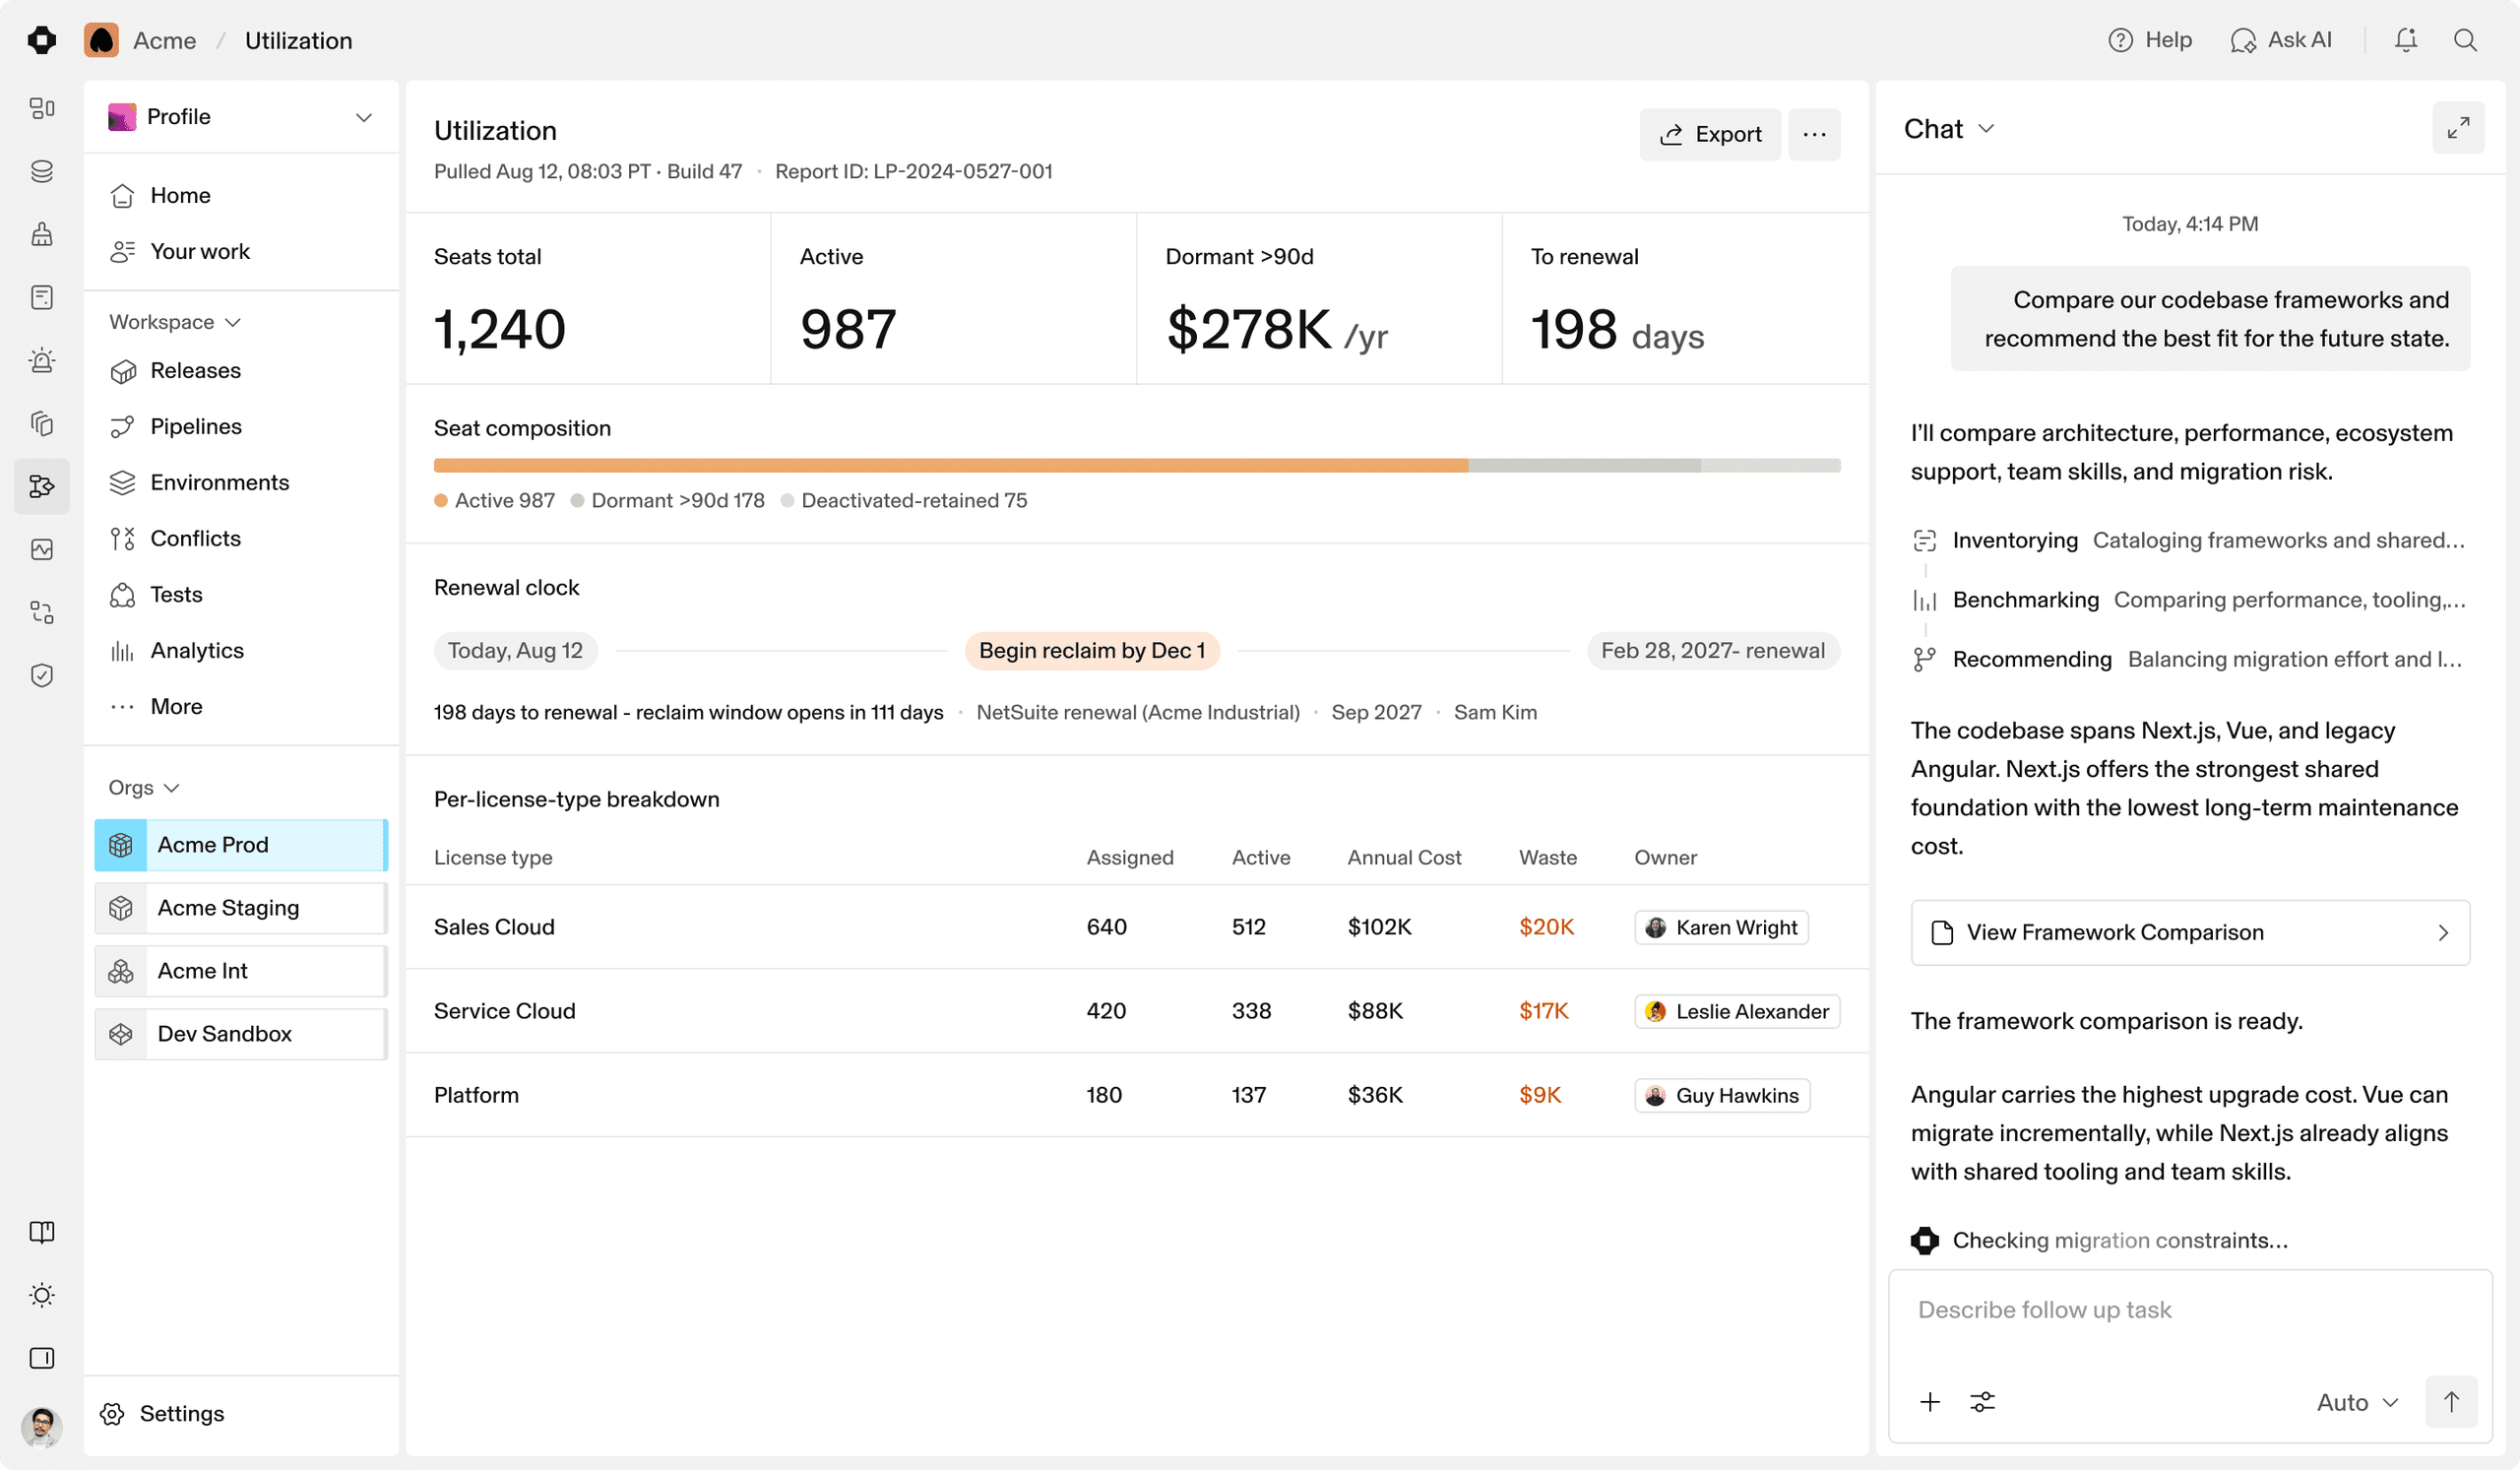
Seats, cost and waste per licence, before each renewal.
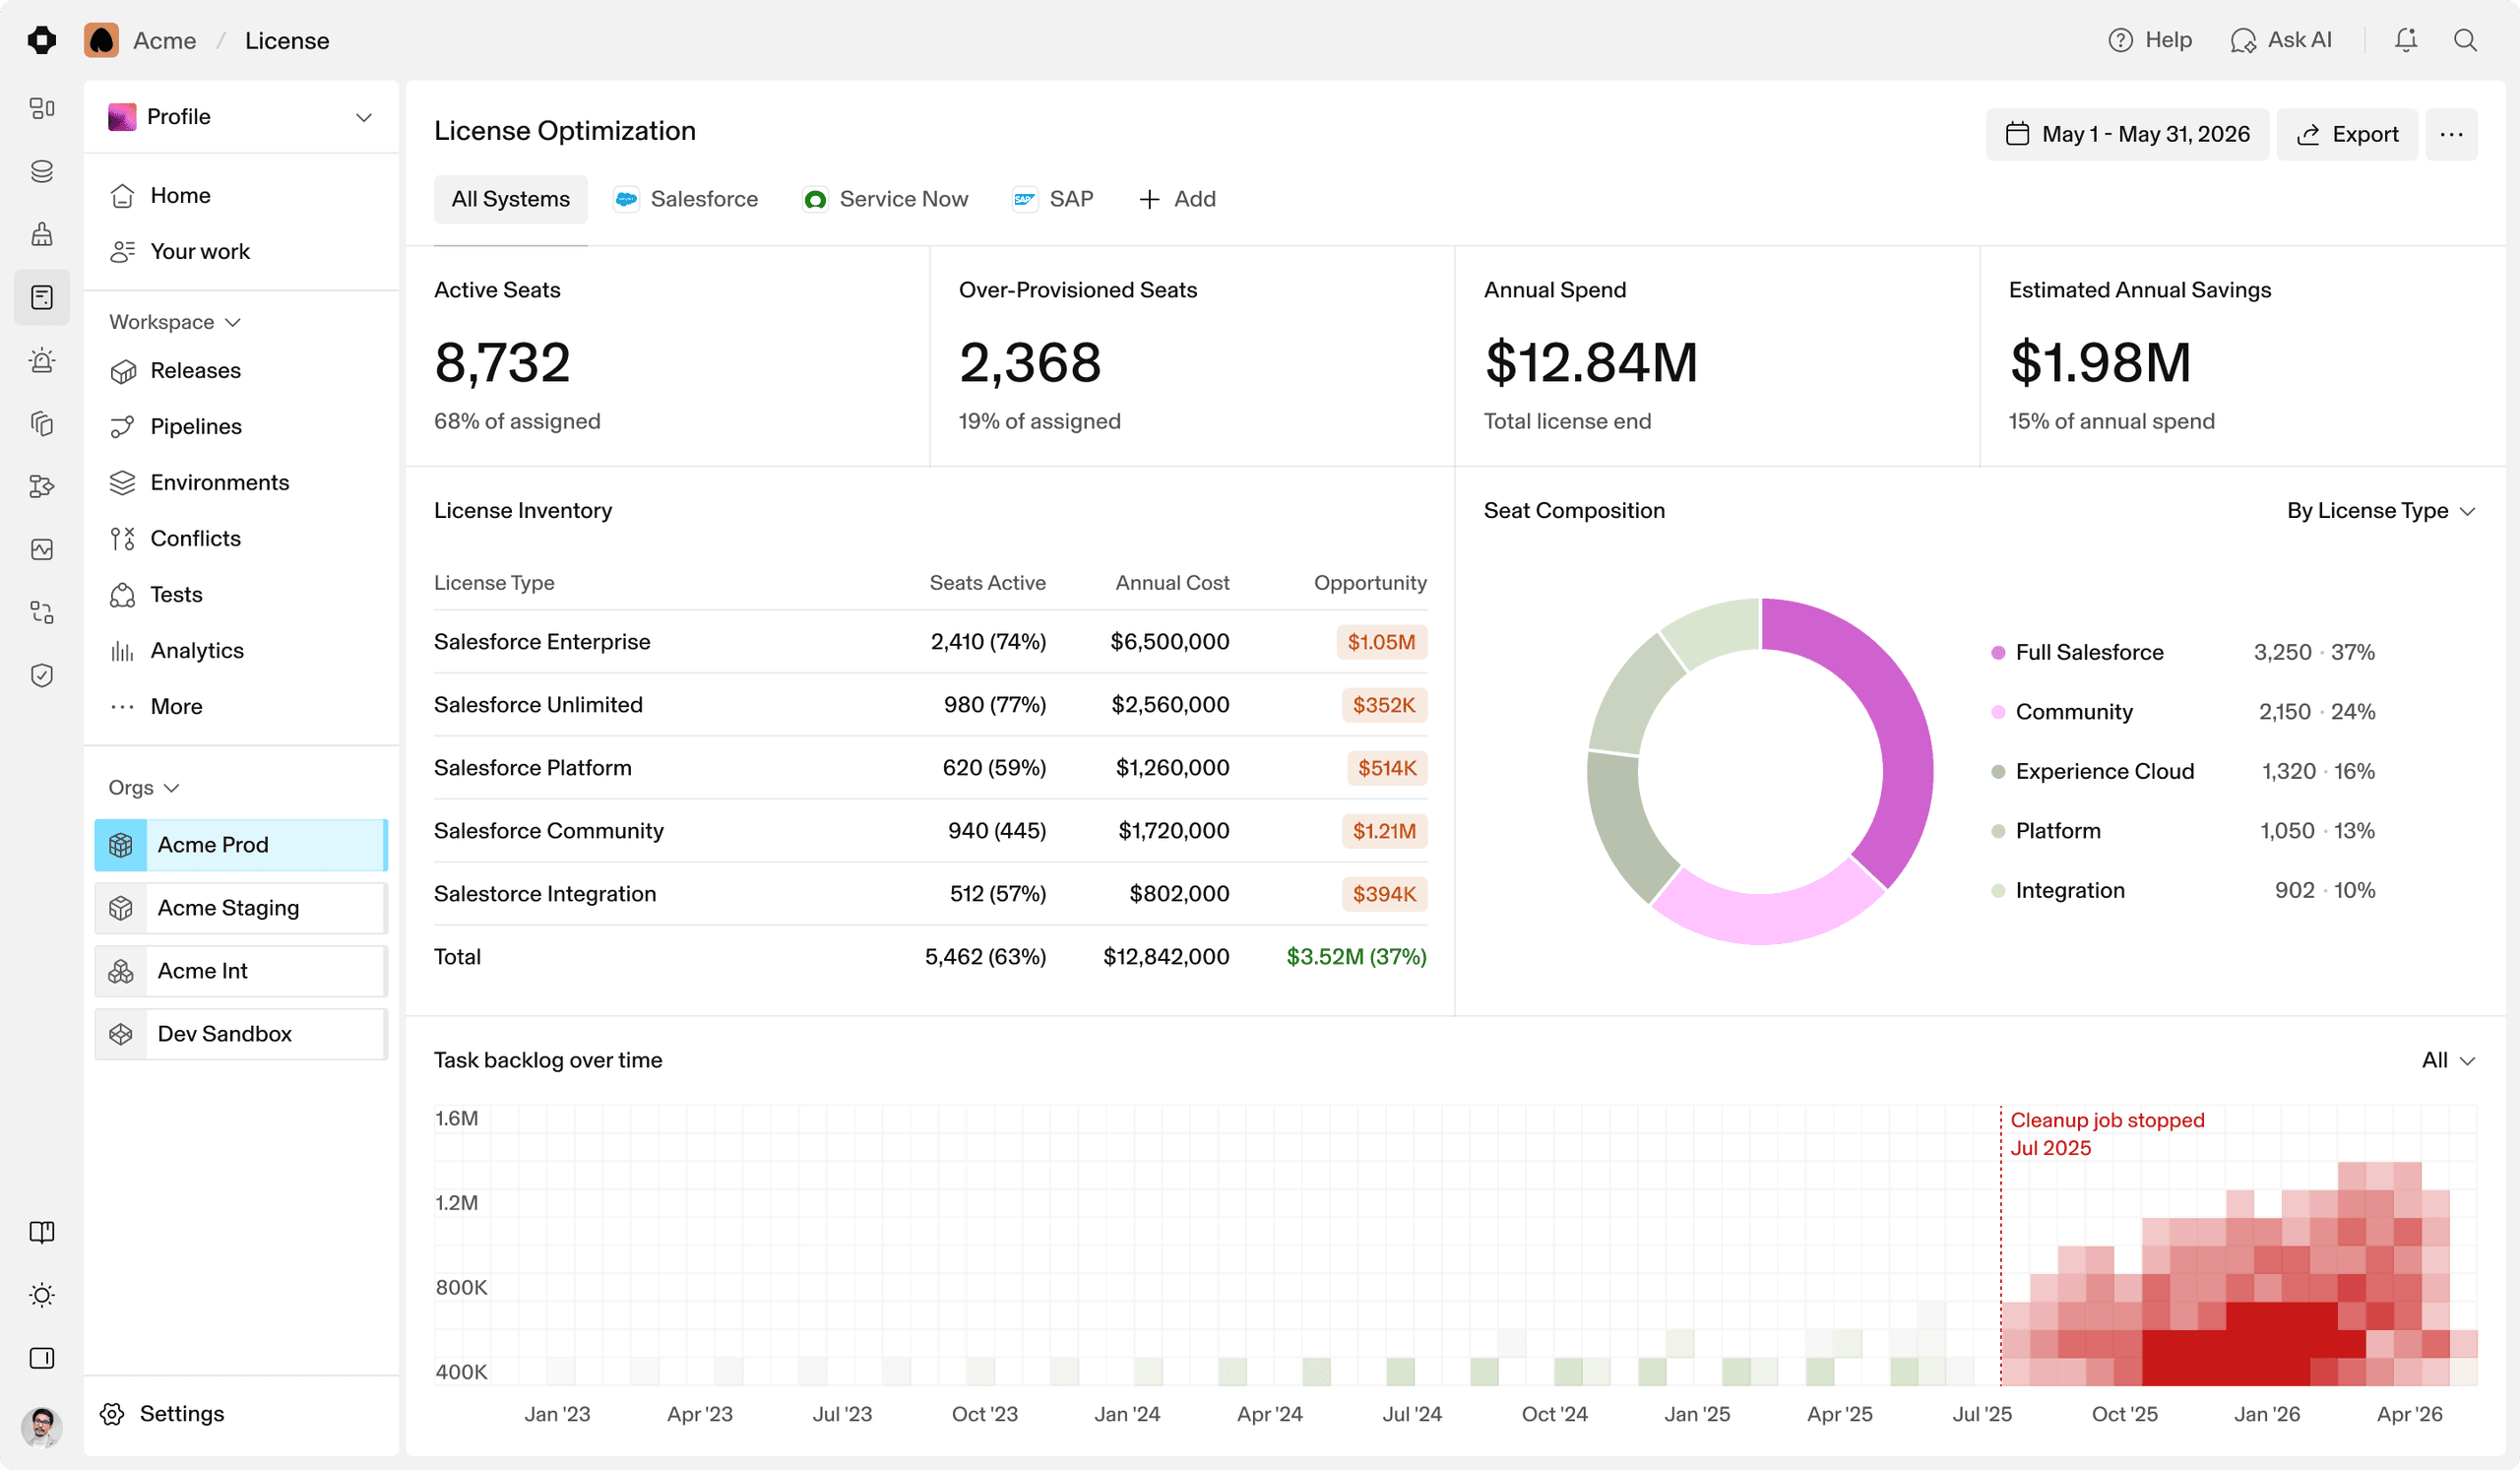
Seats assigned, seats used, and the gap between them.
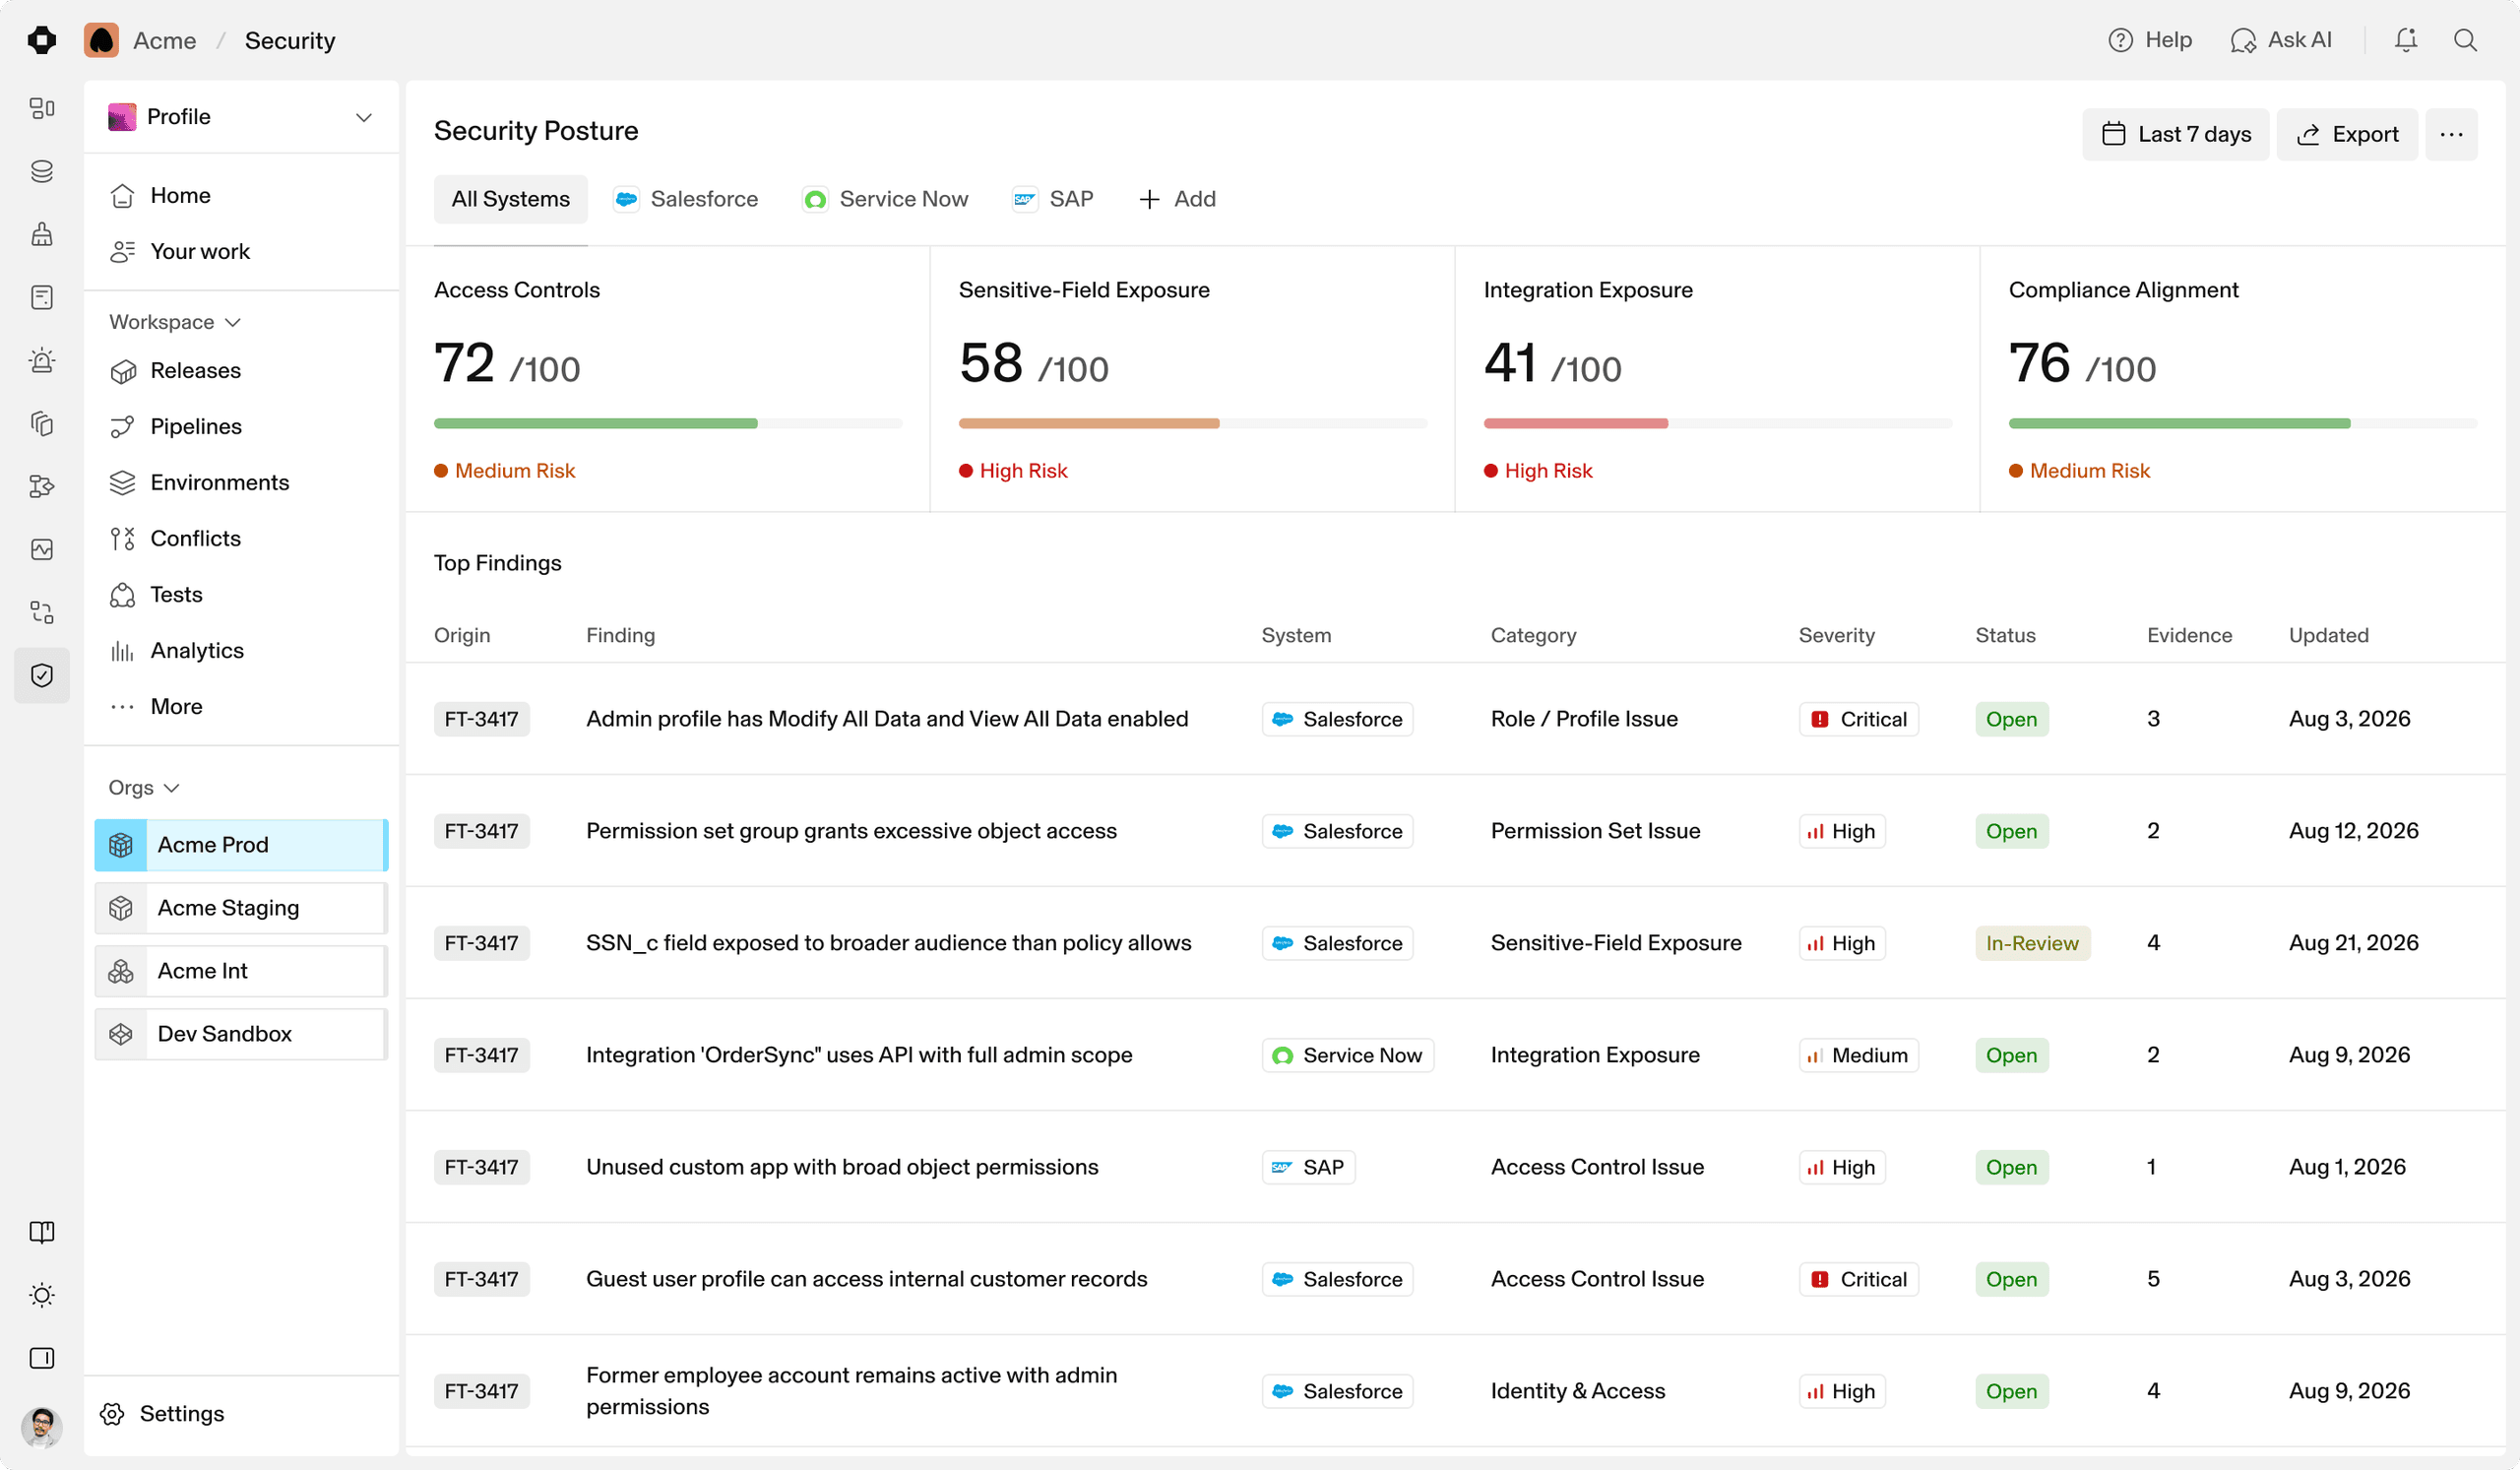
Who can actually see and edit what, resolved to people.
Dependency graph
Every component's relationships, so impact analysis starts before the sandbox does.
Dependency graph
Every component's relationships, so impact analysis starts before the sandbox does.
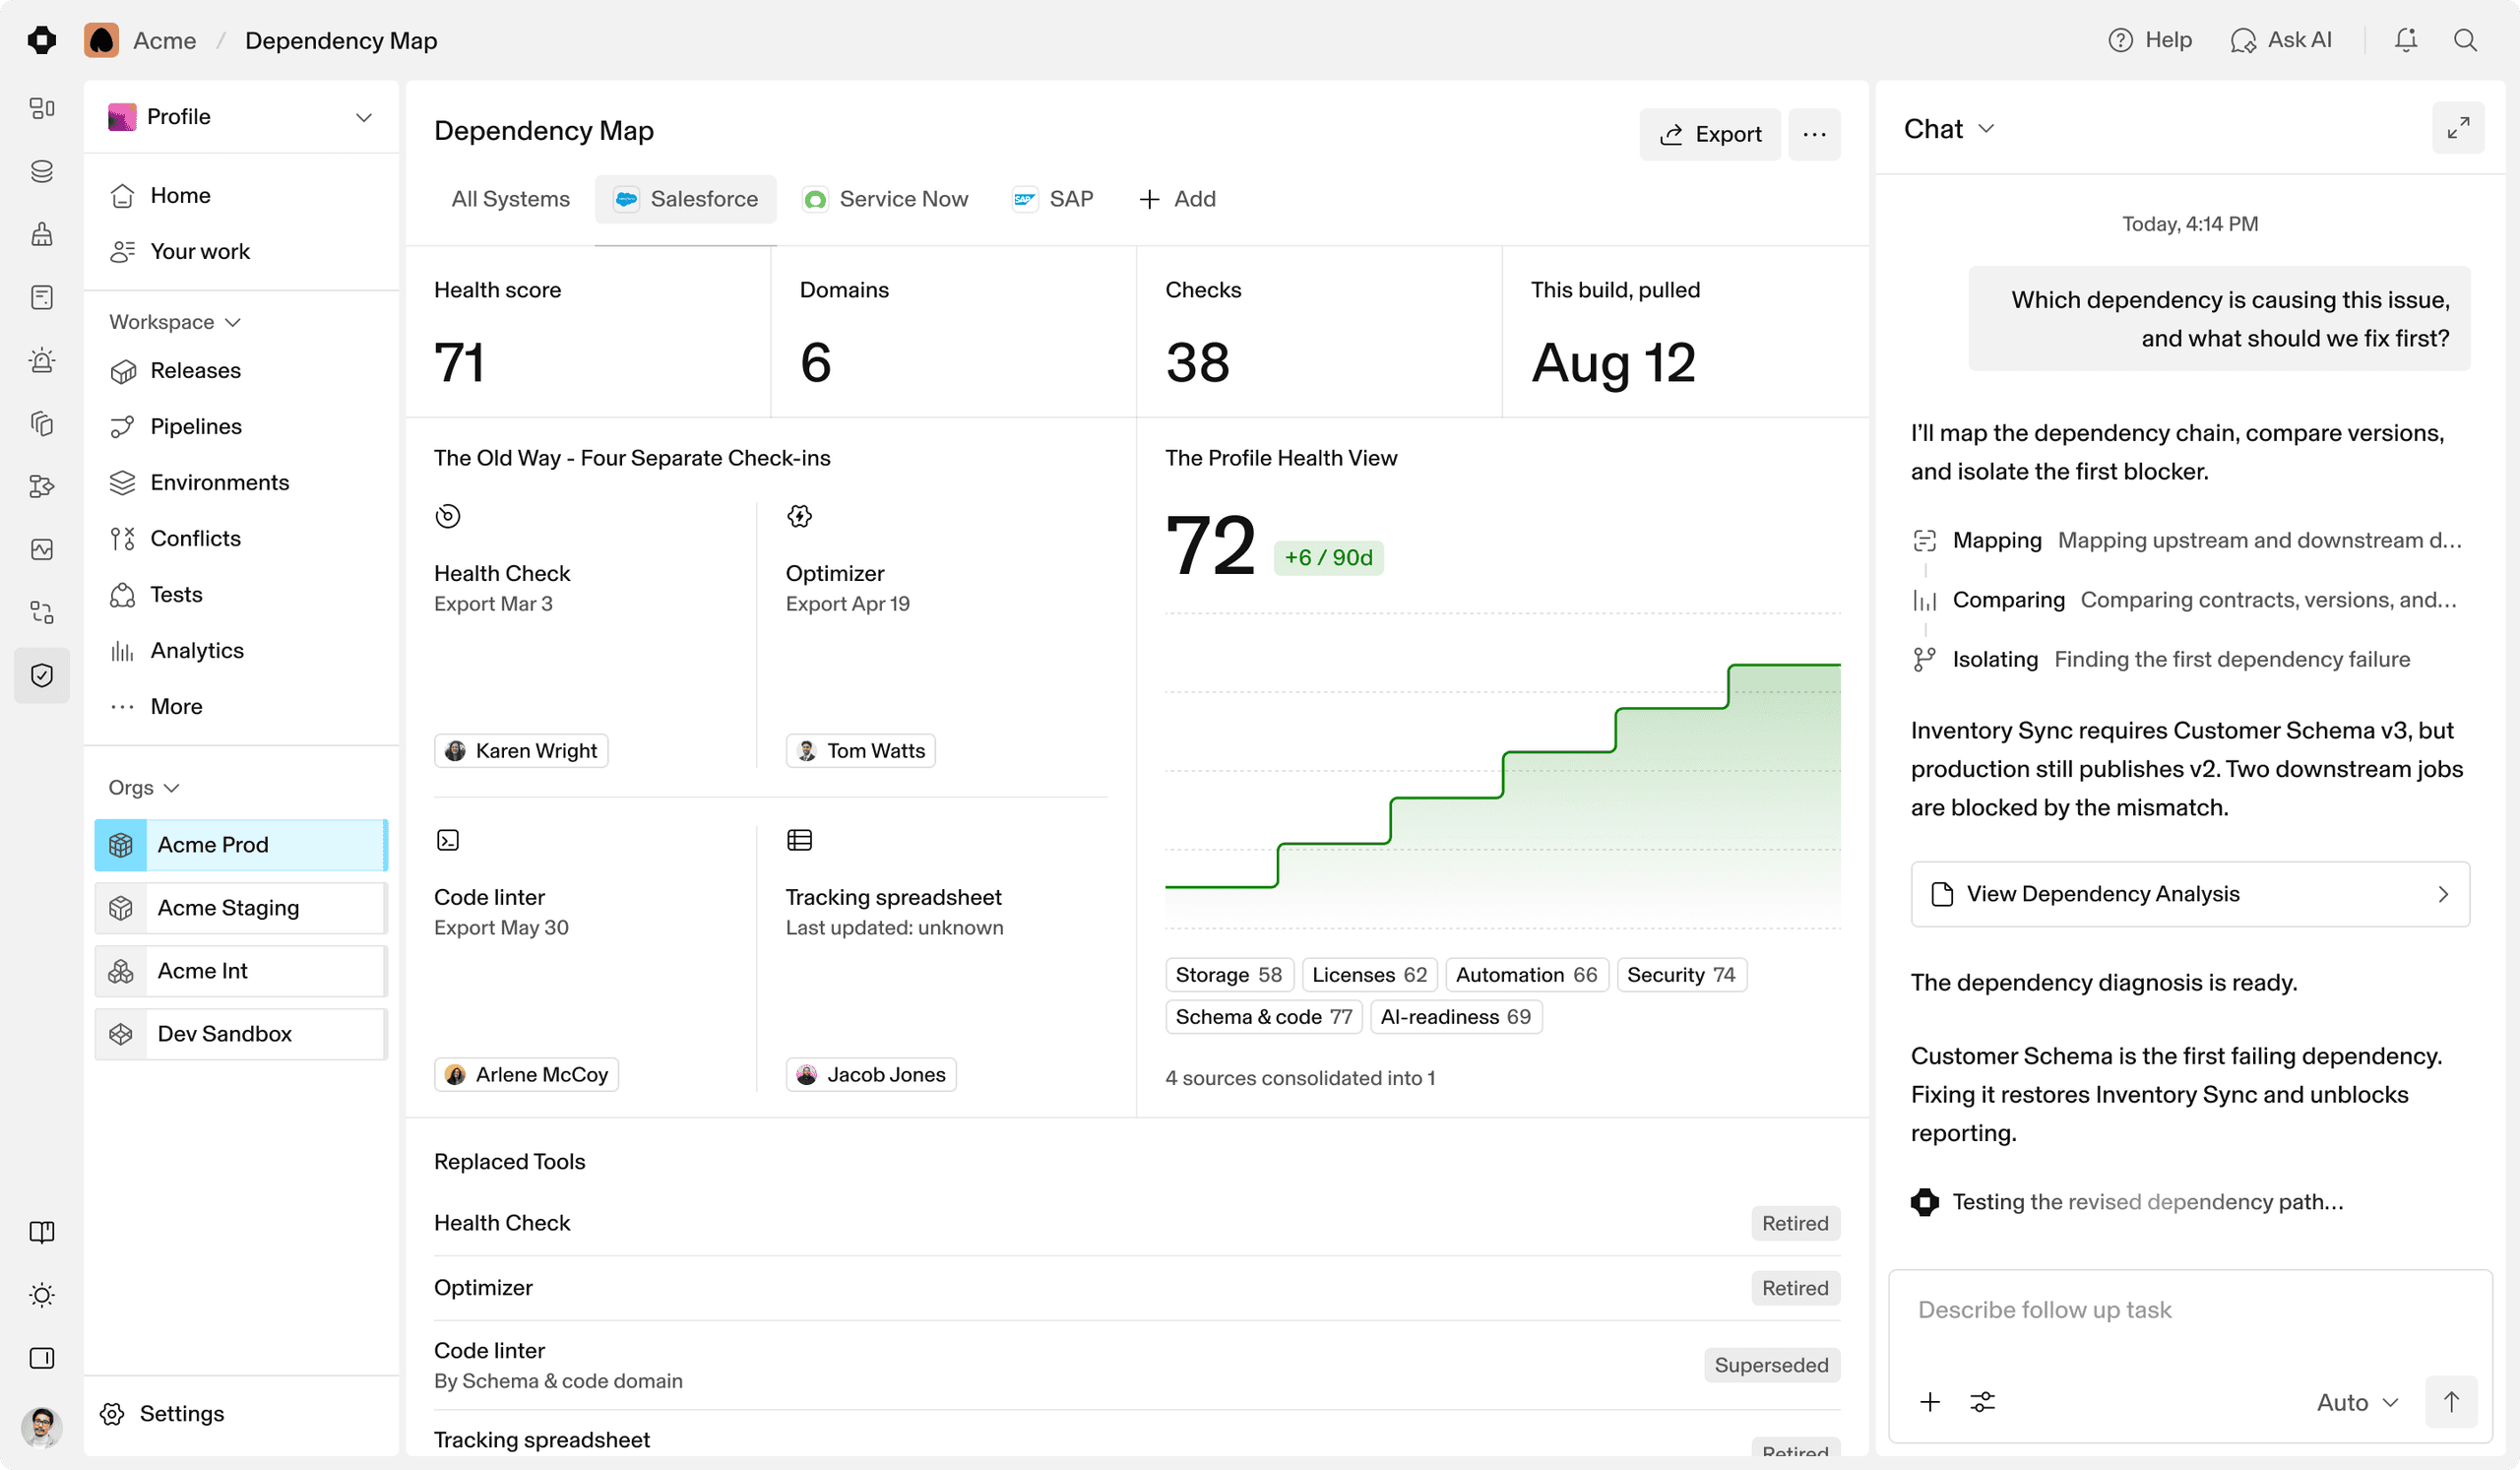
Every object, field, class, flow and layout, and its dependencies.
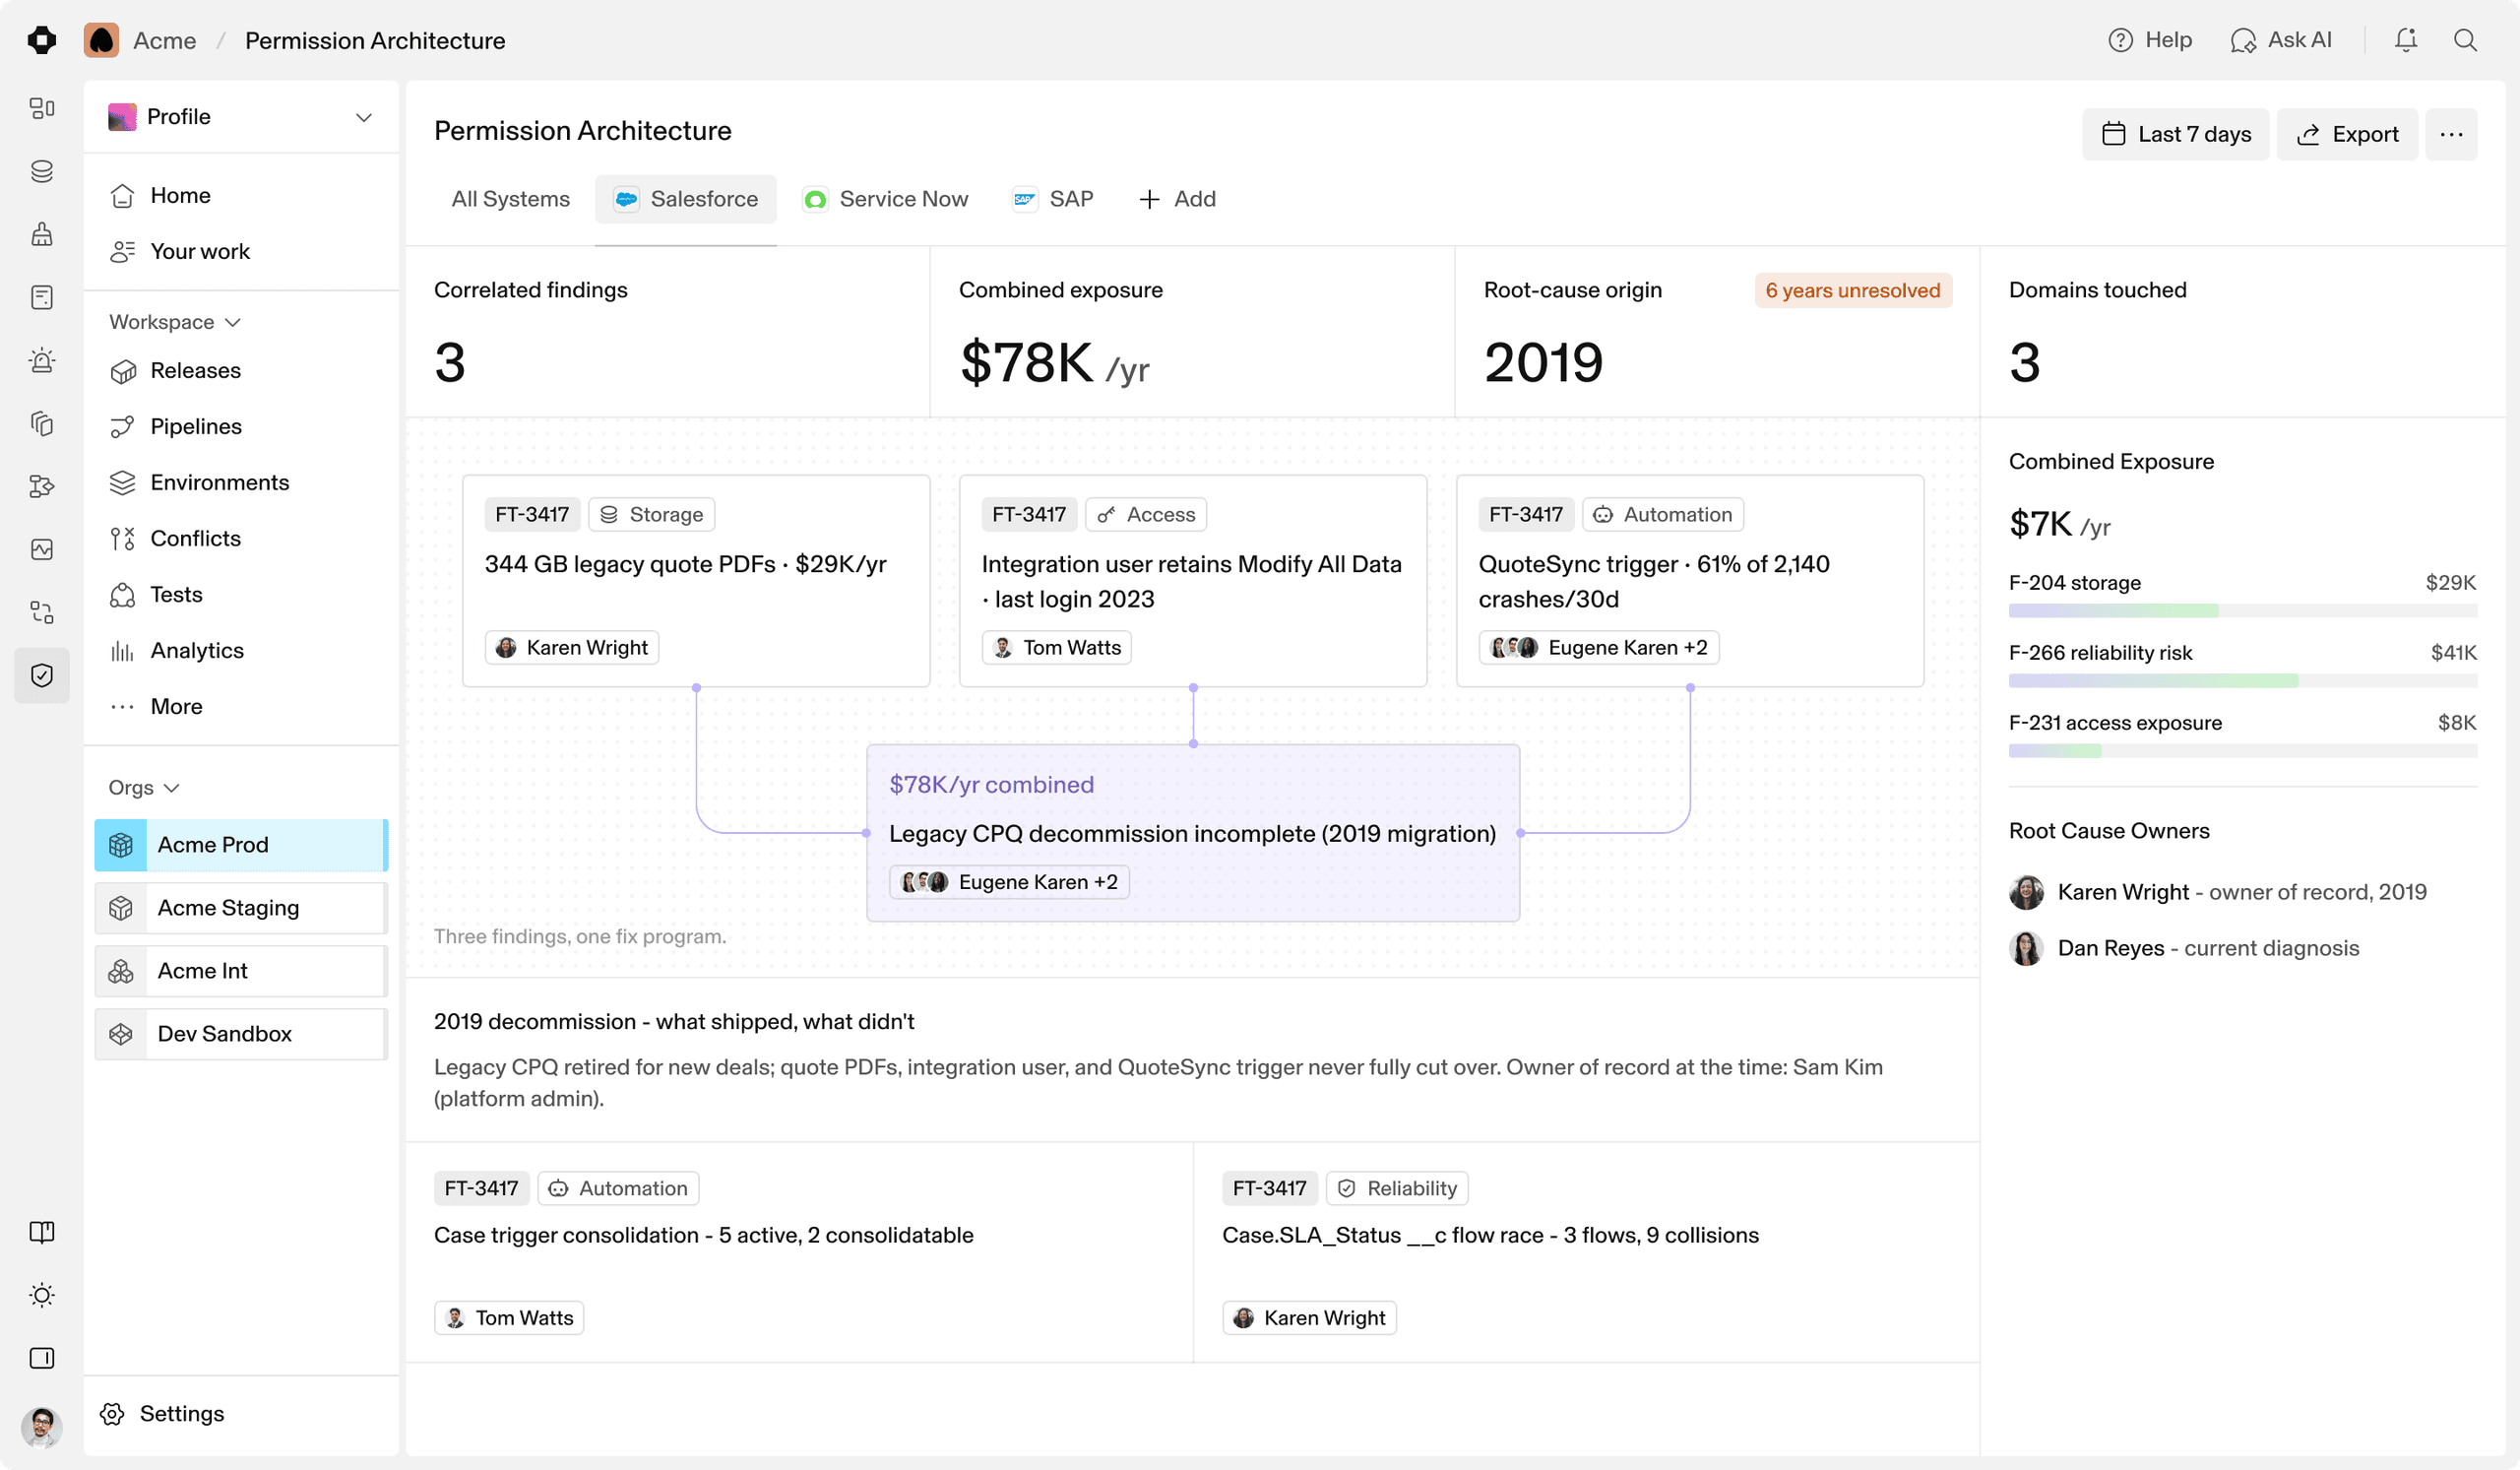
One hop out from any component: what a change reaches.
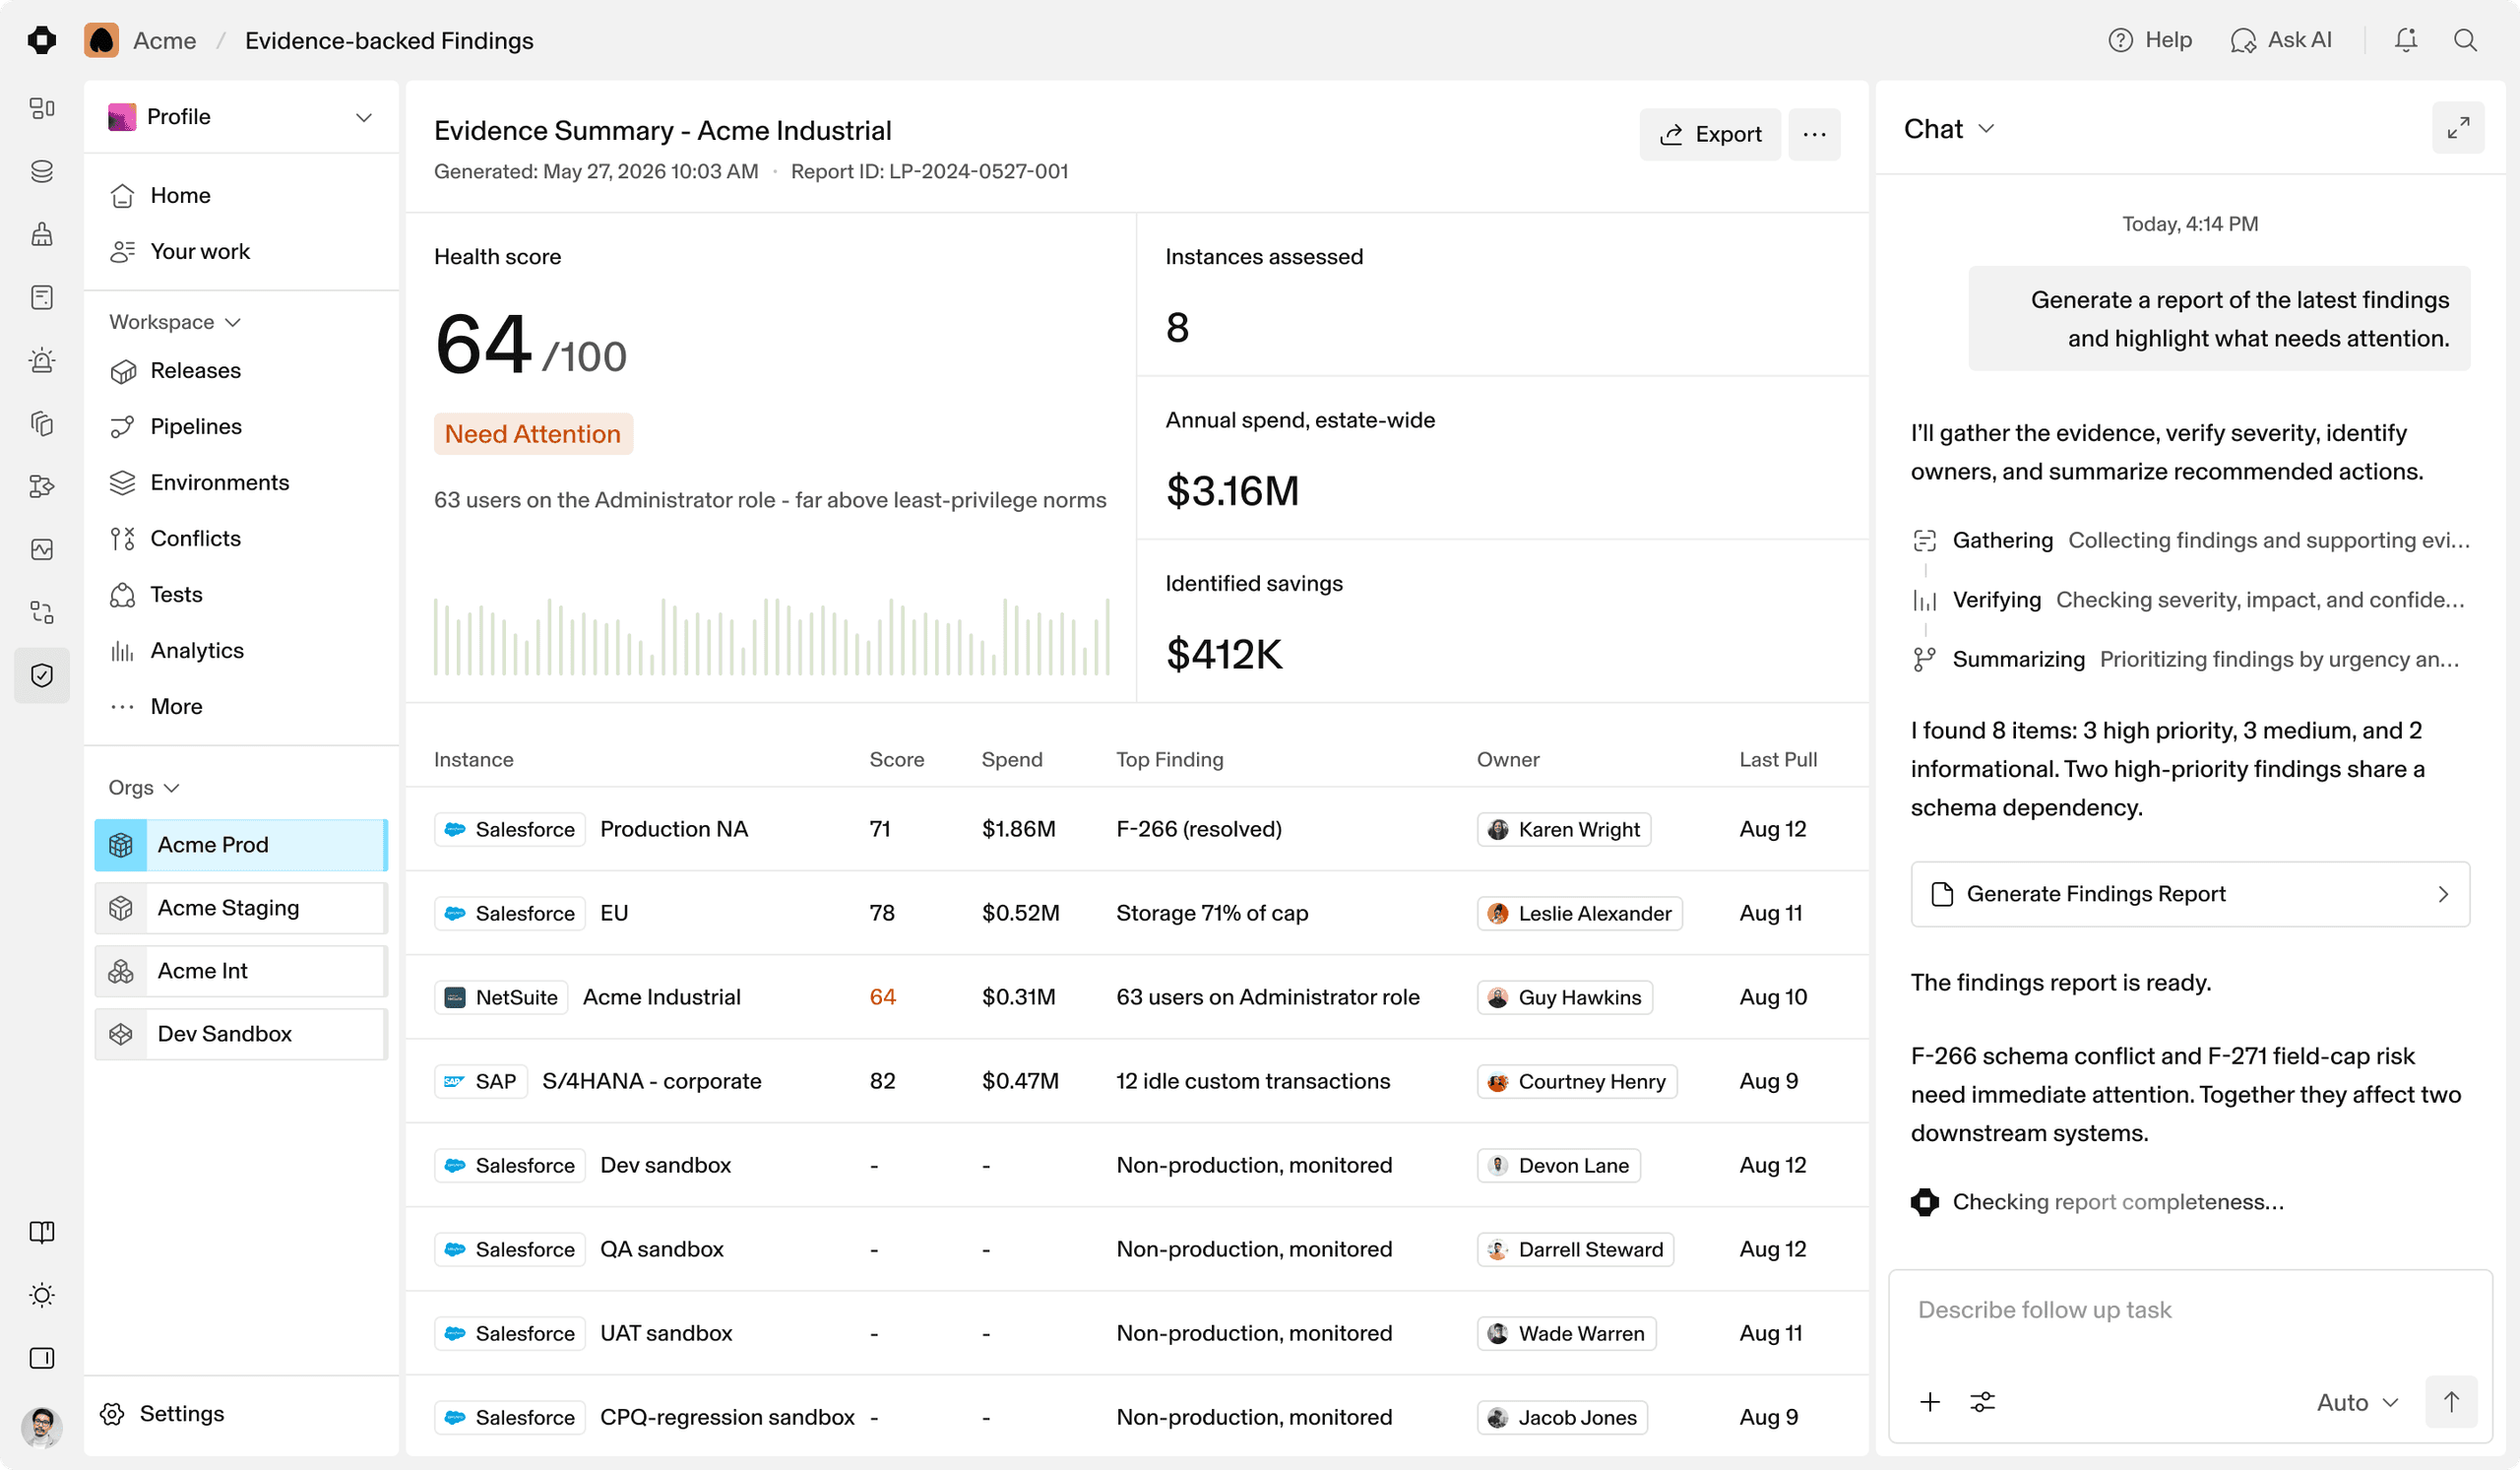
Each org and sandbox scored, with the evidence behind it.
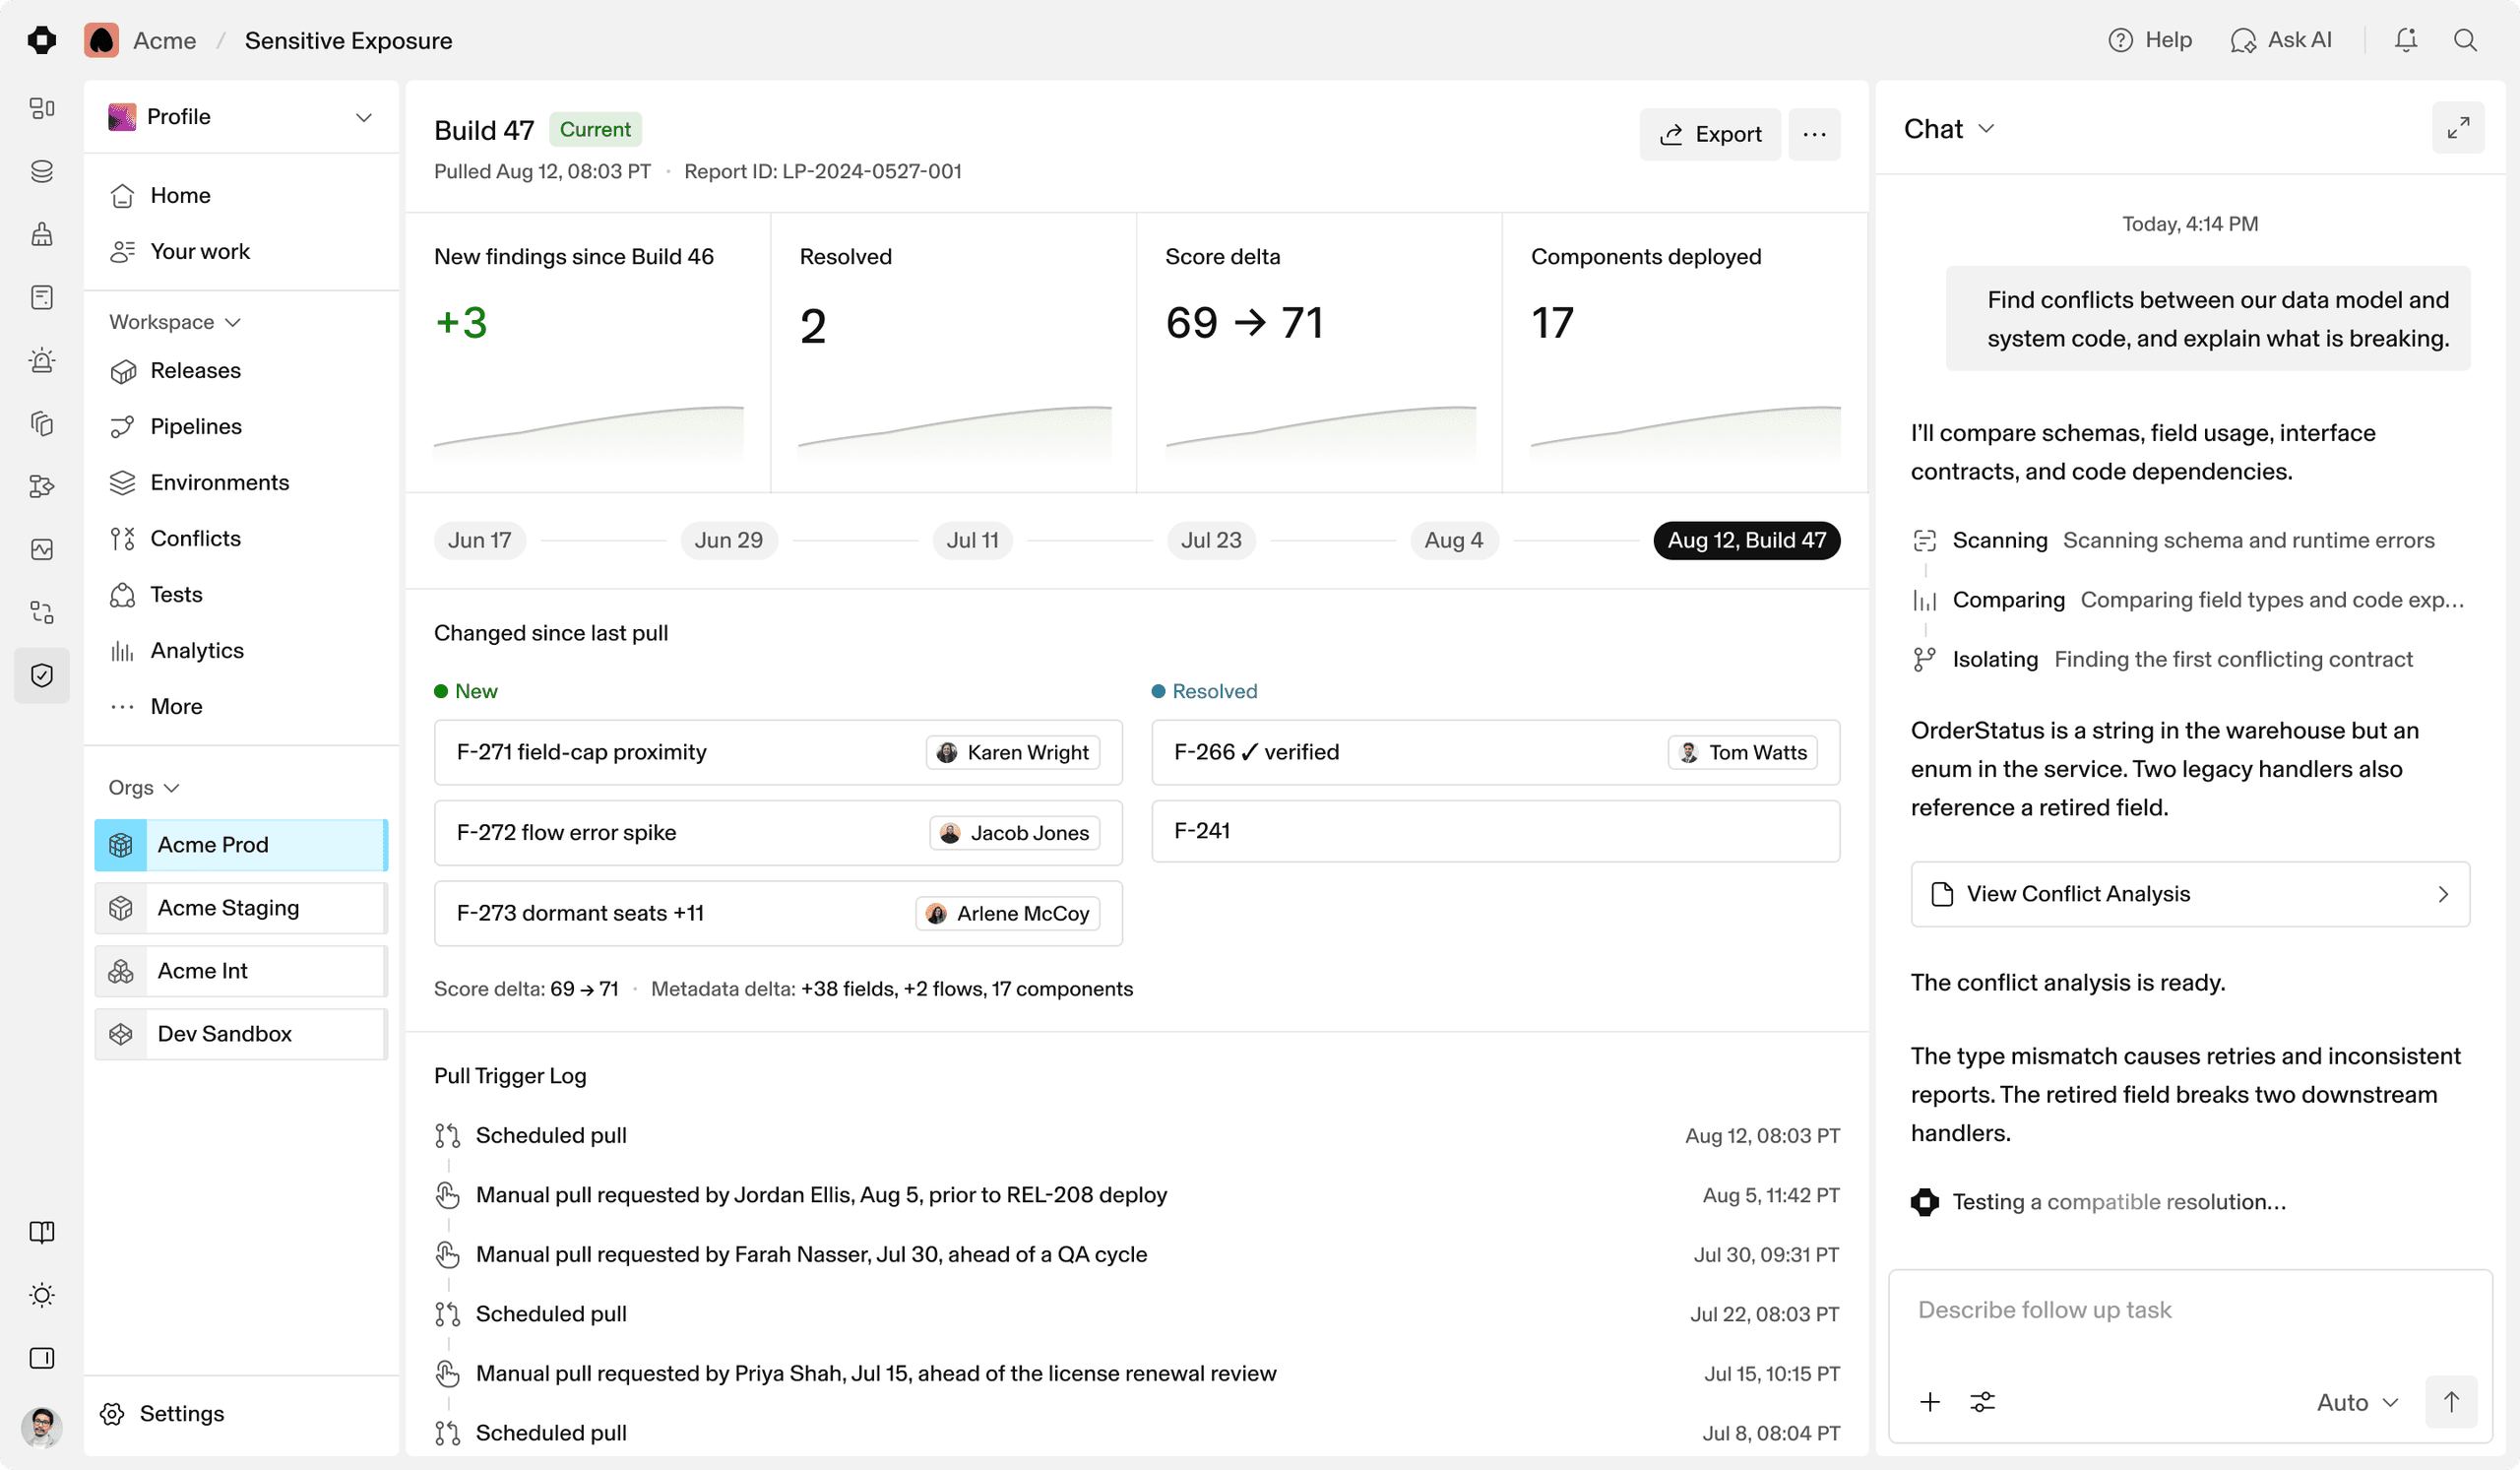
Each read immutable, so you compare the org across releases.
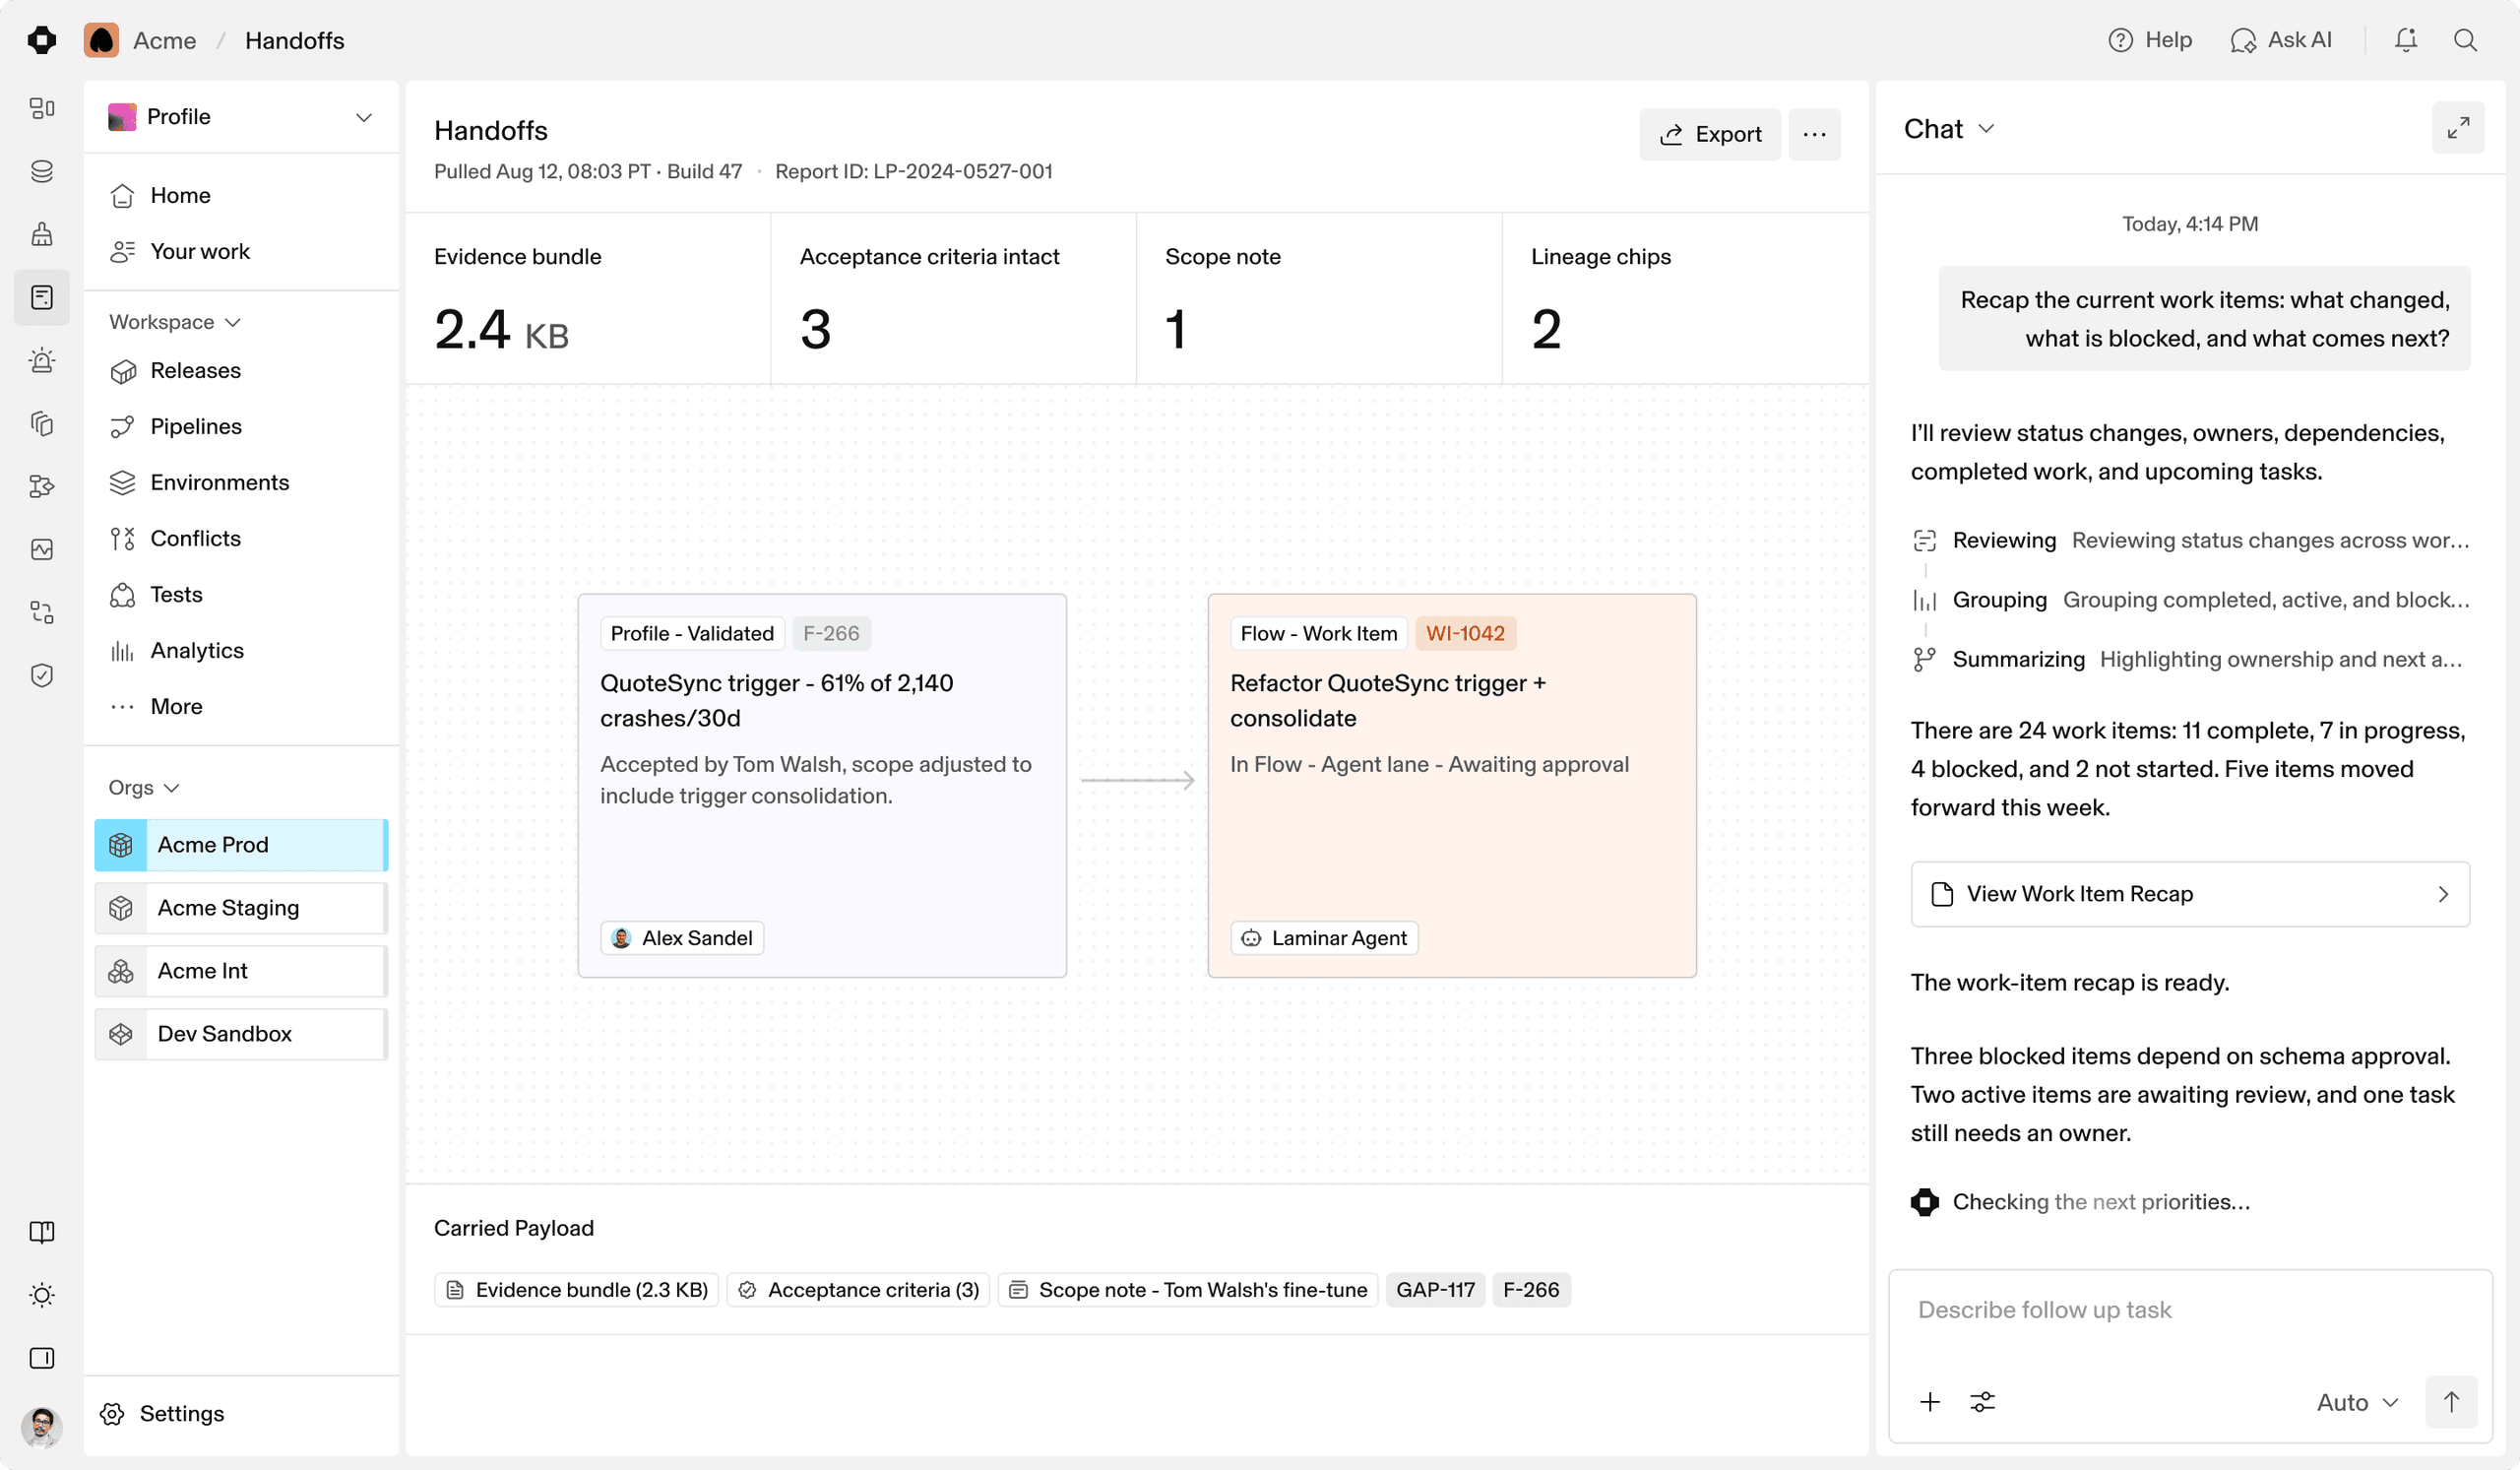
Any finding becomes a work item, carrying its evidence along.
Why Profile
The alternatives either tell you less, or tell you in a deck.
I really love the dependency graph. These are your dependencies. When X thing happens, these are all the places where it's impacting. I love the graph.
After we ran it for our org, one thing I loved about it is its business-oriented results. For active flows, Laminar goes beyond to say, okay, it's not only active but it's not being executed. I think it takes it to another level and shows the context of which business process, which ones we can potentially deprecate, and I could really work with the business stakeholders with that information.
I love that graph where it shows contractually how much we have per license, what the baseline is. We're already putting it into our backlog: how do we get lower in terms of our storage footprint without it being a problem?
Where Profile fits
Shift says where the process stalls; Profile says what in the system is behind it. Flow ships the fix, and Ascent makes sure it clears the same gates as everything else.